Platform
Resources
Product Updates
May 2025
Apr 2025
- 🔮 Surrogate Metrics
- 📊 Compare more Groups in Funnels
- 📊 New Aggregation: Count per User
- ✋ Holdout Analysis in Product Analytics
- 🍩 Donut Chart & World Map 🌍
- ⚙️ New Chart Options in Metrics Explorer
- 🧭 User Journeys on Warehouse Native
- 🎯 Cohort Filters on Dashboards
- 💉 CURE (CUPED vNext)
- 📜 Helm Charts for Forward Proxy
Mar 2025
Feb 2025
Jan 2025
- ⚙️ Custom Metrics in Funnels
- 📊 Distribution Charts++
- 🐍 Python Server Core
- 👤 User Profiles
- 🕵Differential Impact Detection
- 💾 Results in your Warehouse
- ☕️ Java Server Core
- ⚔️ Interaction Detection
- ⚙️ Improved Console Settings
- Slicing by frequently used user properties
- Debug Data Ingestion Errors
- 👥 Filtering by User Dimensions in Custom Metrics
Dec 2024
Nov 2024
Oct 2024
- 📋 Dynamic Configs Now Have Templates!
- 🎉 SCIM User Provisioning
- ⏱️WHN Compute Transparency
- 🥇 First-Value metrics
- 🔍 Focused Analysis with Top Group Limits
- ⚡Inline Power Analysis
- 🪵🪄 Log transforms
- ⌚💰📊 Latest value metrics
- 👯 Cohort analysis in all charts types
- 🧲 Group-by in Retention Analysis
- 🪜Funnels Now Support Up to 15 Steps
- ⏱️ 2x Funnel Performance Improvements
- 📊 Cohort Analysis in Funnels
- 🔗 Improved Segment Integration
- 💥 Cross-Environment Feature Gates View
- 🚫 Metrics Update: Deprecating event_dau metric
Sep 2024
Aug 2024
- 🎛️ Dashboard Filters
- 🧠 Experiment Knowledge Base
- 🎓 Meta Analysis : August Release
- ✨🛤️✨User Journeys Overhaul
- 📧 Dashboard PDF Export
- 🚀❤️📊 Statsig <3 Funnels
- 📅 Expanded Chart Granularities and MAU support
- 🧲 Retention Overhaul
- 🕒 Session Analytics Private Beta
- 📋 Custom Experiment Checklist
- 📈 WHN Product Analytics
- 🤳 Parameter Stores
- 🤖 Bot Filtering
Jul 2024
- 📊 Benjamini-Hochberg
- 🔗 Combine Events in Funnel Steps
- 🔍 First-Time Filters in Funnels
- 🌊 Session Streams
- ⌨️ Keyboard Navigation
- 📊 Outlier Detection
- 💾 Reusable Cohorts
- 🧢 Capped Metrics (WHN)
- 🕵 Differential Impact Detection
- 💄 New look and feel on Statsig
- 👩💻 Statsig Managed API Proxy
- 🏠 New Home Experience
- 🧮 Improved Formula Support
- 🙋♀️ User Management v2
- 🎓 Meta Analysis : July release
Jun 2024
May 2024
Apr 2024
Mar 2024
Feb 2024
Jan 2024
Nov 2023
Aug 2023
Jul 2023
Jun 2023
Apr 2023
Mar 2023
Feb 2023
Jan 2023
Dec 2022
Nov 2022
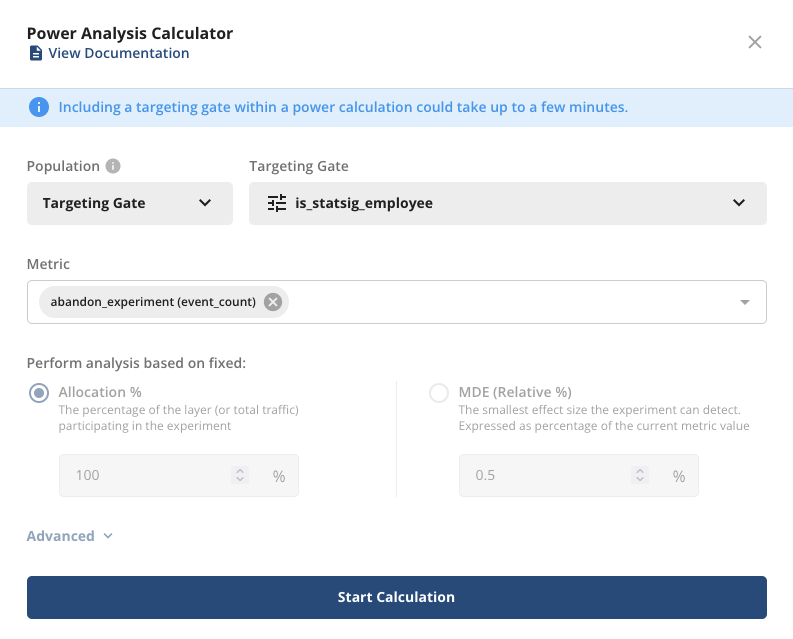
Incorporating more granular target population in Power Calculator calculations
Now, you can specify which audience you want to calculate experimental power for, by selecting any existing Feature Gate via the Power Calculator.
To do this, go to the Power Calculator (either under “Advanced Settings” in Experiment creation or via the “Tools & Resources” menu) and select “Population”.
This will kick off an async power calculation based on the selected targeting gate’s historical metric value(s), and you will be notified via email and Slack once your power analysis is complete.
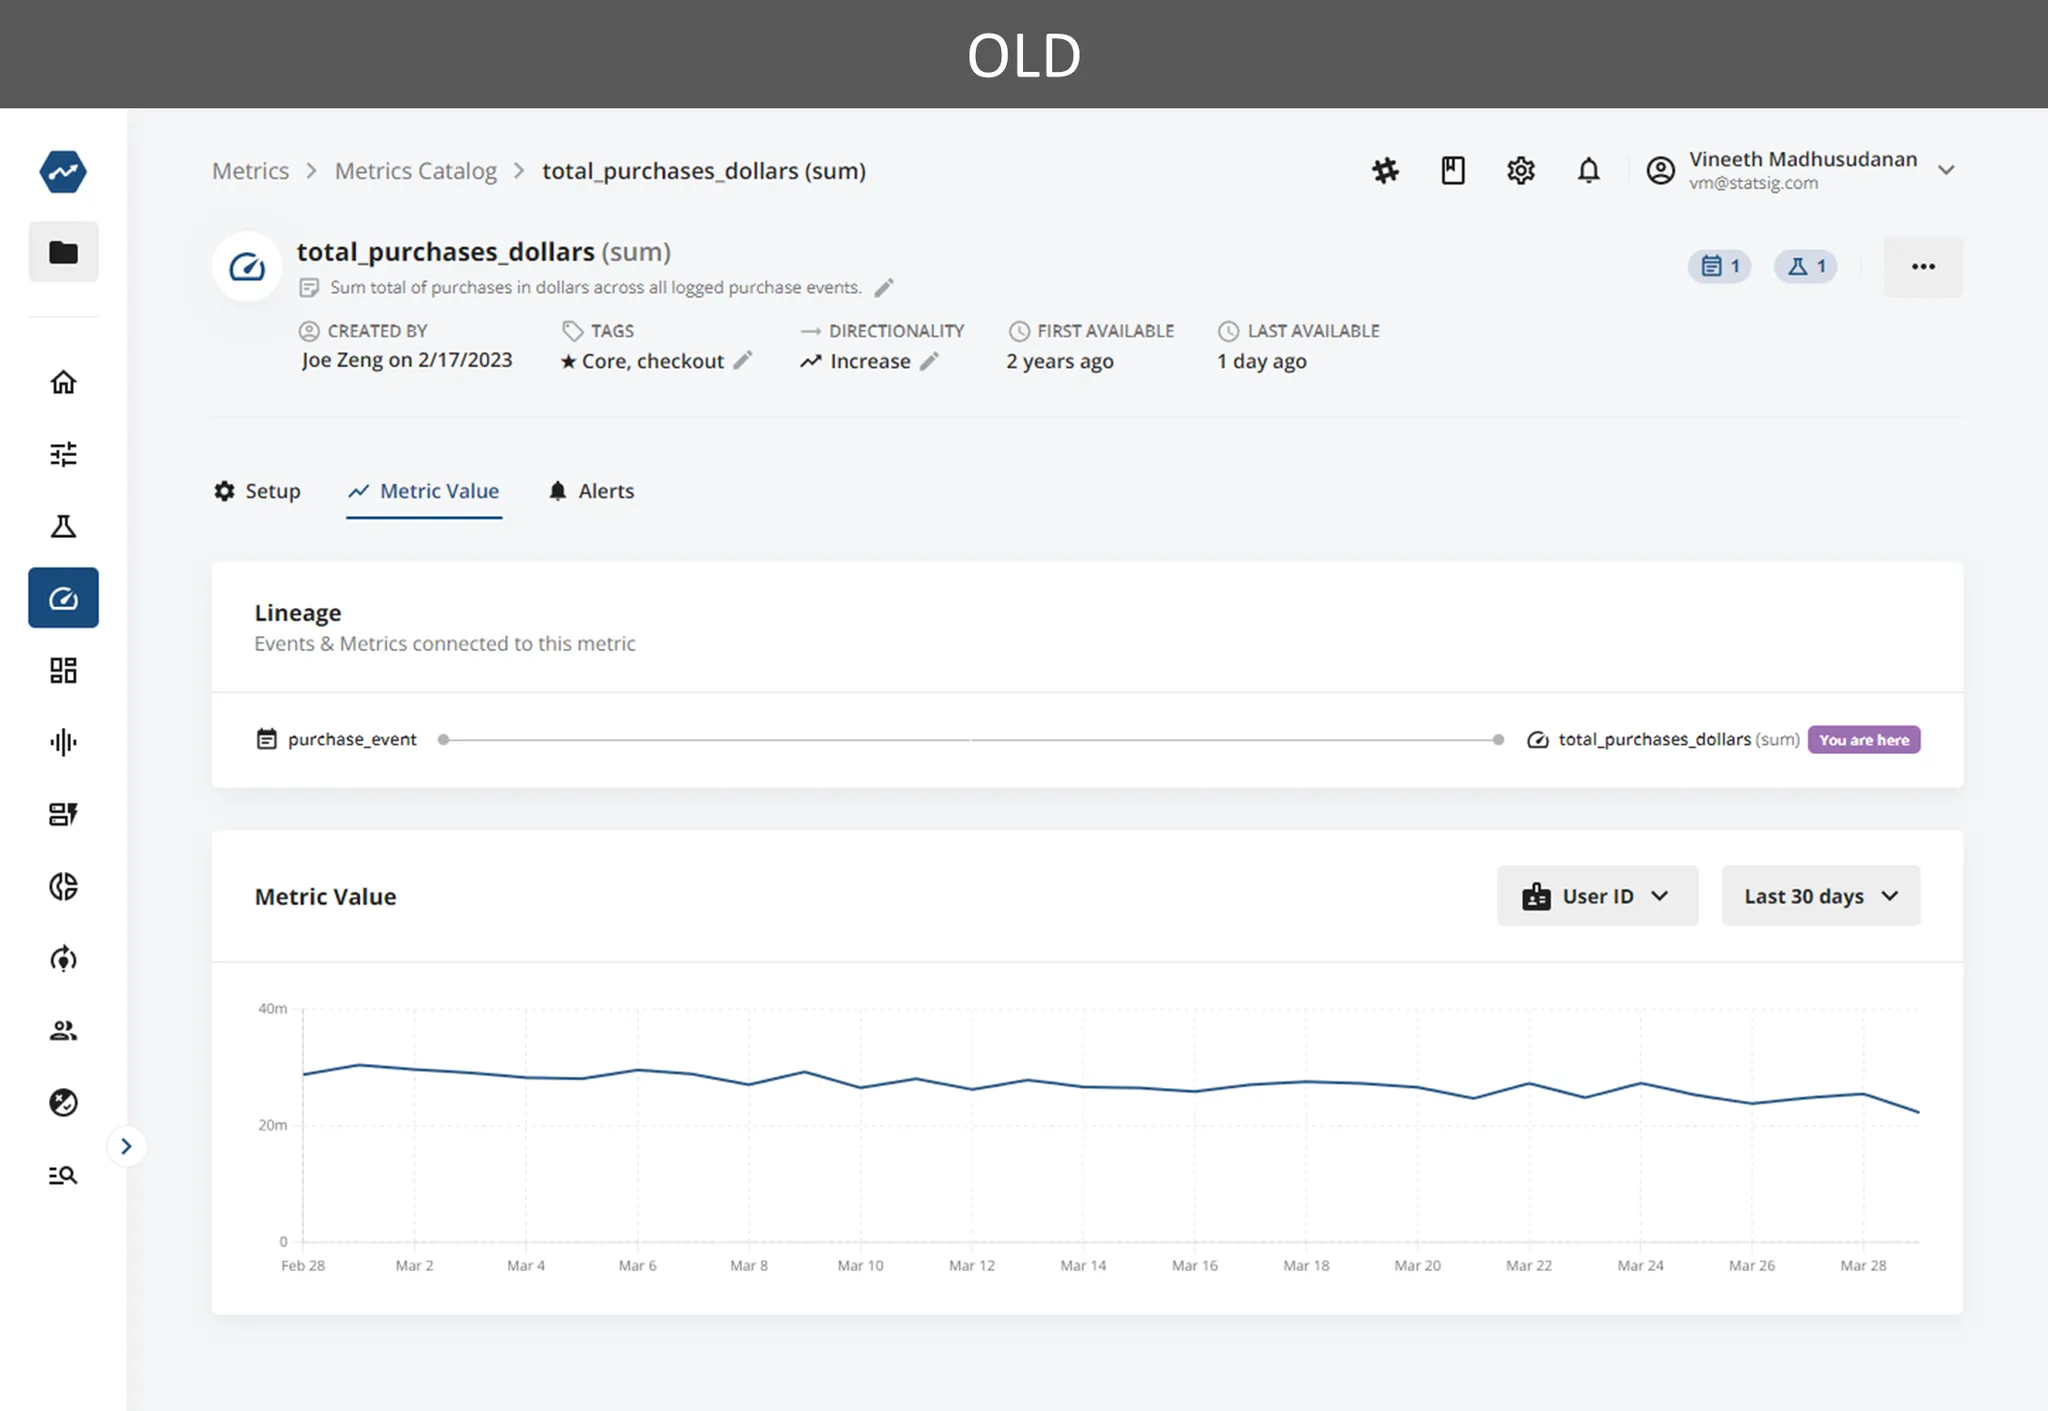
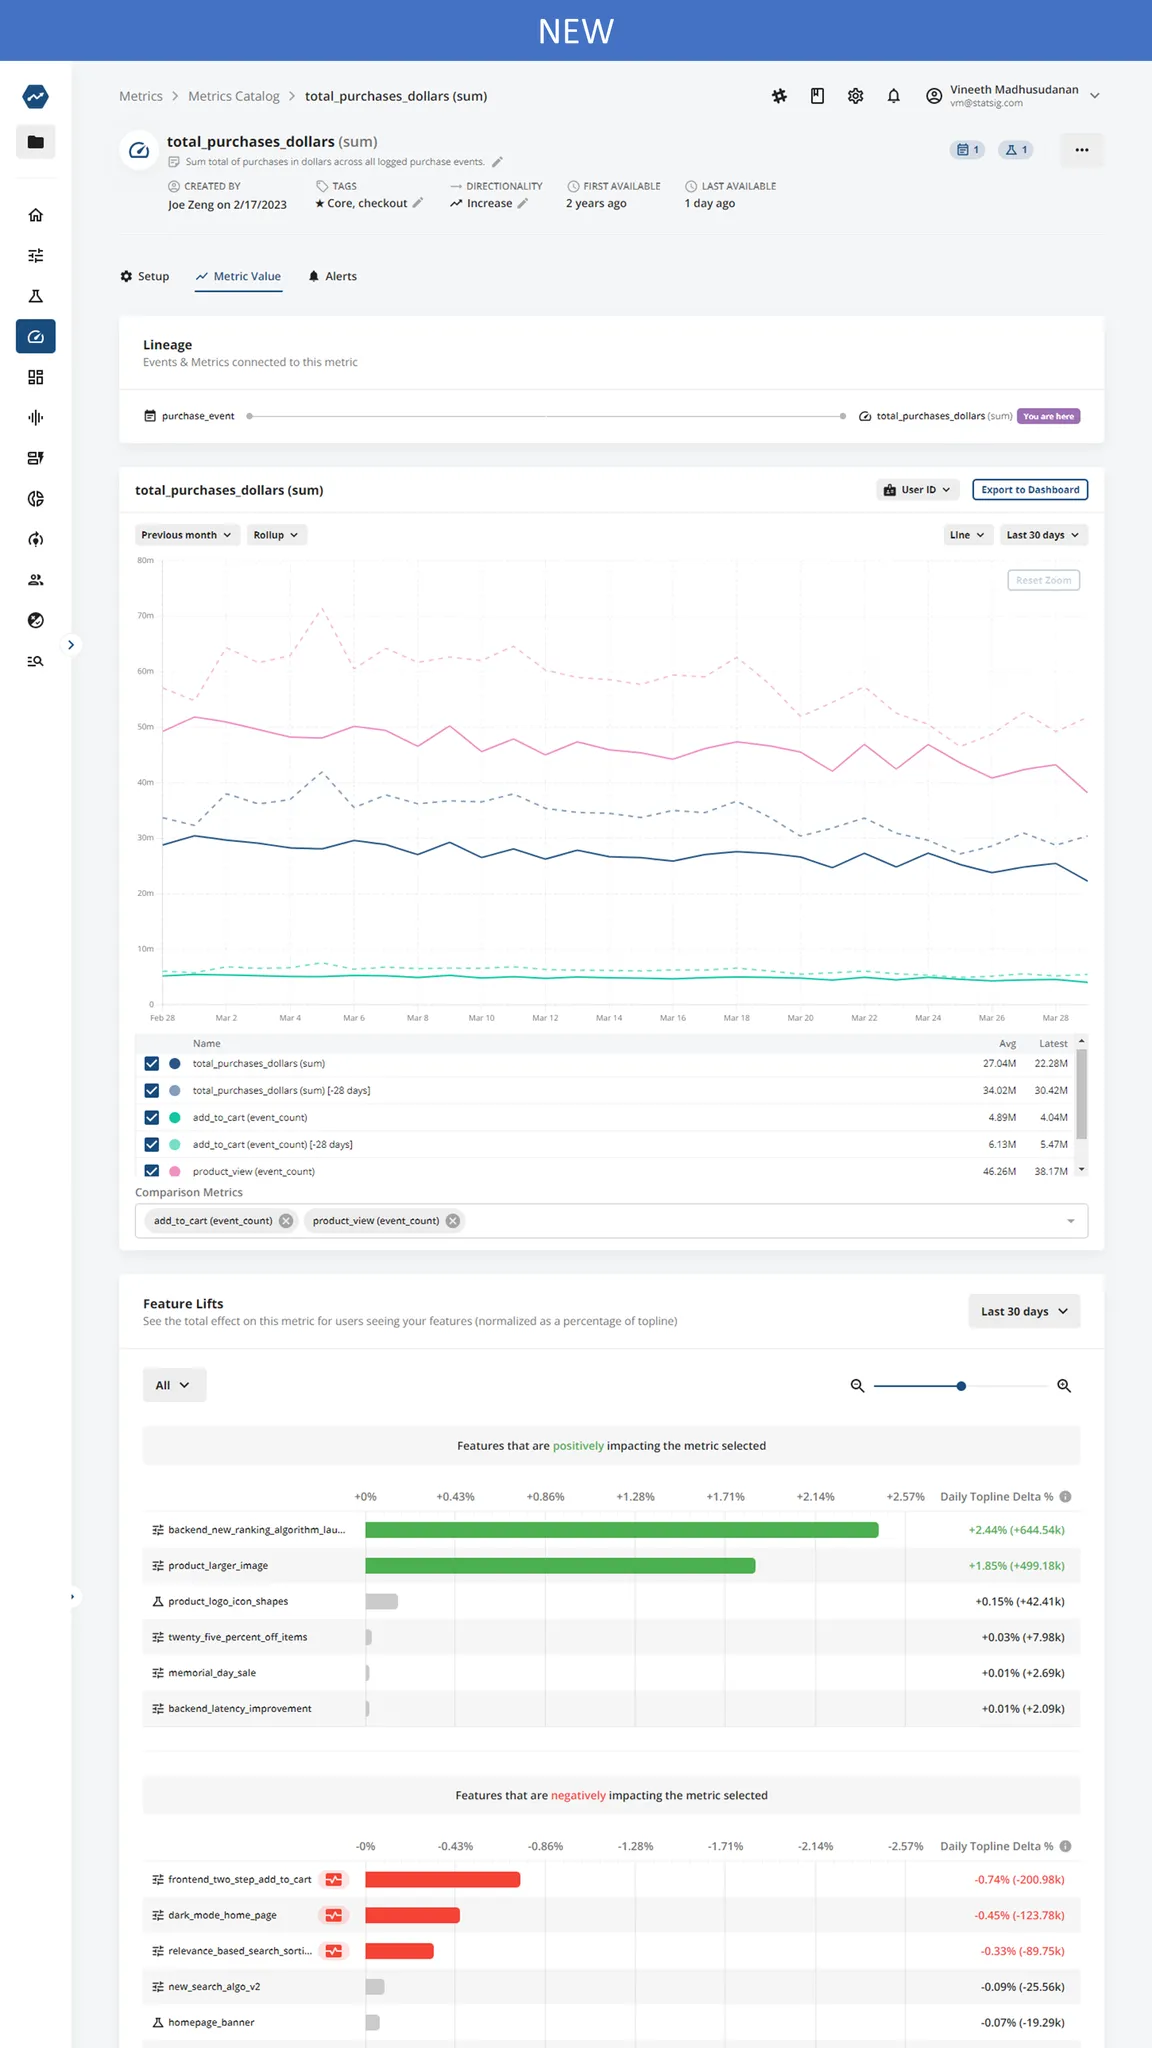
Explore metrics outside just an experiment
We’ve heard from some folks that they want to explore metrics even outside an experiment’s context. We’ve just started adding capabilities to do this. Now, when you’re looking at a metric in the Metrics Catalog you can:
compare values to a prior period to look for anomalies
apply smoothing to understand trends
look at other metrics at the same time to see correlation (or lack thereof) group by metric dimensions
save this exploration as a Dashboard to revisit/share with others
view current experiments and feature rollouts that impact this metric (also in Insights)
This starts rolling out March 31.