Products
Solutions
Resources
Sequential Testing on Statsig
Sequential testing is a solution to the “peeking problem” in A/B testing, allowing continuous monitoring of experiment results without increasing the False Positive Rate (FPR).
We recently revamped Statsig’s Sequential Testing methodology to enable faster decisions. Compared to our previous implementation, this new approach has higher statistical power during the early days of the experiment while enforcing a strict cap on FPR. This is ideal for early regression detection or shortening experiment duration when the key metric has a larger-than-expected effect.
The need for sequential testing
A common concern when running online A/B tests is the “peeking problem”. This arises when experiment metrics are continuously monitored with the intention of making early ship decisions. This stems from a tension between two aspects of online experimentation:
Ongoing metric updates
Unlike A/B tests conducted in fields like Psychology and Drug Testing, state-of-the-art online experimentation platforms use live data streams and can surface results immediately. These results can then be updated to reflect the most up-to-date insights as data collection continues. Naturally, we want to leverage this powerful capability to make the best decisions as early as possible.
Limitations of the underlying statistical test
In fixed-horizon hypothesis testing, we accept a predetermined FPR, typically 5% (alpha = 0.05). When the p-value is less than 0.05, it’s common practice to reject the null hypothesis and attribute the observed effect to the treatment we’re testing. We do this knowing that there’s a 5% chance that a statistically significant result is actually just random noise.
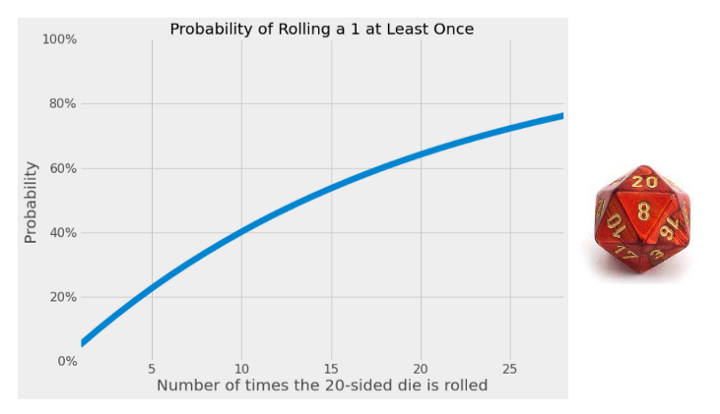
However, ongoing monitoring while waiting for significance leads to a compounding effect of the 5% FPR. Imagine you have a 20-sided die. If you roll it once, you’ll have a 5% (1 in 20) chance of getting a 1. But if you roll it every day for a week, the probability of getting a 1 at least once is much higher than 5%. In fact, you’ve now increased your chances to 30%.
The solution
In Sequential Testing, the confidence interval computation changes in a way that maintains the desired upper bound on false positives regardless of how many times the metric is evaluated.
Statsig’s sequential testing methodology
Statsig’s new Sequential Testing methodology is based on the mSPRT (mixture Probability Sequential Ratio Test) approach described by Zhao et al. This is a commonly used methodology, where the test statistic is based on the likelihood ratio of the null and alternative hypotheses.
We conducted extensive testing, both with simulated distributions as well as data from real-life experiments, and found that this meets the desired criteria for Sequential Testing:
The false positive rate in A/A tests remains below 5% even with repeated measurements over a 4-week period.
When a real effect exists, statistically significant results can often be detected earlier than the target duration of the experiment.
Evaluation details
In our evaluation, we compared the new mSPRT methodology with our previous approach, as well as with the standard z-test used in fixed-horizon tests.
Power and early stopping probability
We evaluated the power of our method using a corpus of 560 recent experiments on Statsig, which included nearly 2 thousand scorecard metrics. The analysis covered a wide array of product metrics from various industries (time spent, revenue, subscription rate, latency, messages sent, retention, etc.). For each experiment, the target duration and scorecard metrics were set by the experiment creator.
We focused on scorecard metrics that were stat-sig based on the fixed-horizon z-test at the end of the target duration. The chart below shows the probability of sequential testing showing a stat-sig result as a function of duration. When the result is stat-sig, this means the experiment could be stopped early if using Sequential Testing.
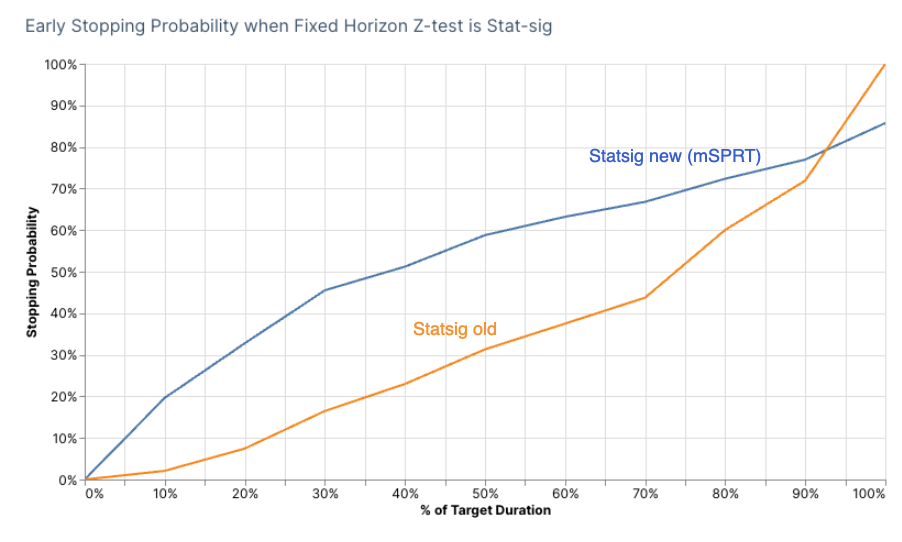
Our new method has a higher probability of identifying stat-sig results early compared to our previous one. This is one of the reasons for releasing this update: Sequential testing offers more value when it reveals results early and shortens experiment duration.
It’s worth noting, however, that we don’t reach the same level of power at the end of the experiment. This is a trade-off we cannot escape when enforcing a cap on FPR. It’s worth keeping this in mind when opting for Sequential Testing over a standard fixed-horizon test.
| Methodology | Power Relative to Fixed-Horizon Test | Early Stopping Probability at Half of Target Duration |
|---|---|---|
| Fixed-horizon | 100% | 0% |
| Statsig new (mSPRT) | 84% | 58% |
| Statsig v1 | 100% | 33% |
False positive rate from simulated A/A test
The best way to assess FPR is with A/A tests that are expected to have neutral results. We carried out 10 thousand simulated A/A tests with the following parameters
100k users per group, enrolled over the course of 14 days. This mirrors the common pattern of users gradually being exposed to an experiment over the course of its duration.
Two metrics are generated for each user. The first one is drawn from standard normal distribution, the second one from a normal distribution with mean of 1 and standard deviation of 0.1
The results show that FPR for the new methodology is safely below 5%. As expected, the fixed horizon z-test is around 5%, while z-test with peeking is significantly higher (over 20%). Our previous methodology did not strictly enforce a cap on FPR, and it does show slightly higher FPR compared to fixed-horizon z-test (5.5%), but still much lower than z-test with peeking.
| Methodology | FPR (standard normal) | FPR (mean=1, std=0.1) |
|---|---|---|
| Fixed-horizon | 5.3% | 4.9% |
| Statsig new (mSPRT) | 0.4% | 0.2% |
| Statsig old method | 5.5% | 5.2% |
| Z-test peeking | 20.9% | 21.5% |
False positive rate from real data
We also leveraged existing data on Statsig to evaluate the FPR of our method with real-world metrics. This is an important step because the metrics we see in experiments can have distributions and participation rates that are different from the synthetic data sets.
We generated 50 thousand A/A tests using over 5 thousand metrics from 100 different customers of various sizes. The tests had a duration of 28 days and evaluated both ratio and event count type metrics. Again, our results confirm that the FPR for our mSPRT methodology is consistently below 5%.
| Methodology | Overall FPR | ratio FPR | event_count FPR |
|---|---|---|---|
| Fixed-horizon | 5.0% | 4.6% | 5.0% |
| Statsig new (mSPRT) | 1.1% | 1.1% | 1.2% |
| Statsig old method | 5.7% | 5.4% | 5.7% |
| Z-test peeking | 17.3% | 20.1% | 17.3% |
Get started now!

Recommended best practices
The best use of Sequential Testing is often in combination with traditional, time-bound hypothesis testing. Sequential Testing is best leveraged to identify regressions or make ship decisions based on a single metric.
Product experimentation on Statsig often involves multiple scorecard metrics that provide a holistic view of the test’s impact. In those cases, it’s advisable to utilize fixed-horizon testing for full statistical power across all metrics of interest. Some ideas to keep in mind:
Why early decisions are beneficial
While “peeking” is sometimes frowned upon, early monitoring of tests is actually critical to getting the most value out of an experimentation program. If an experiment introduces a measurable regression, there’s no reason to wait until the end to take action. With sequential testing, we can readily distinguish between statistical noise and strong effects that are significant early on.
Another use-case for Sequential Testing is when there’s an opportunity cost to running the experiment for its full duration. For example, withholding an improvement from users may have a significant engineering or business cost, or ending an experiment early may unblock the path for further tests.
Don't forget about guardrails
It’s exciting to see a goal metric with a stat-sig effect early on. A word of caution before making an early decision: While one metric may reach significance early, other metrics that appear neutral may still be underpowered.
Account for weekly seasonality
Even when all metrics of interest look great early on, it’s often advisable to wait at least 7 full days before making a decision. This is because many metrics are impacted by weekly seasonality when the end users of a product have different behaviors depending on the day of the week.
Effect size
If a good estimate of the effect size is important, consider running the experiment to completion. For one, Sequential Testing adjusted confidence intervals are broader, so the range of likely values is larger when making an early decision (lower precision). Additionally, a larger measured effect is more likely to be statistically significant early on, even if the true effect is actually smaller.
Routinely making early decisions based on positive stat-sig results could lead to systematically overestimating the impact of launched experiments (lower accuracy).
In closing
Sequential testing enables ongoing monitoring of experiment results without inflating the False Positive Rate.
It’s a powerful tool for identifying regressions early and reducing their impact on the product. That said, it comes with an overall reduction in statistical power compared to fixed-horizon tests. Thus, we recommend utilizing this method for early ship decisions only when there’s a single metric of interest for the experiment.
Related reading: CUPED explained
Request a demo
