Products
Solutions
Resources
Product experimentation best practices

Step 1: Experiment design
Investing in a proper experiment design upfront is the first step in running an experiment that follows best practices. A good design document eliminates much of the ambiguity and uncertainty often encountered in the analysis and decision-making stages.
The design document should include the following:
Experiment description
A quick overview of what this experiment is doing. Can include screenshots of the new feature or motivation for testing it.
Hypothesis
The expected result of the change being tested. This usually includes the impact we expect to see on one or more metrics. It should be stated in a way that can be confirmed or refuted at the end of the experiment by looking at the scorecard metrics.
It’s a good idea to keep the hypothesis simple and focused on the basic piece of knowledge we hope to gain from the experiment. In this way, we’re always learning from experiments even when the metrics don’t support launching the feature.
Metrics
List of the main metrics and criteria we’ll use to make a decision. On Statsig, we group these into Primary and Secondary metrics.
Primary Metrics are the most important metrics related to this experiment. These often include:
Top-level metrics we hope to improve with the experiment (Goal metrics)
Other important company or org-level metrics we don’t want to regress (Guardrail metrics)
Secondary Metrics help us see the bigger picture or support our hypothesis. For example:
A breakdown of different metrics that contribute to the goal metric
Metrics that are “complementary” to the goal metric and could reveal cannibalization effects or trade-offs
Power analysis, allocation, and duration
Allocation
This is the percentage of the user base that will be eligible for this experiment. In many cases, maximizing allocation is desirable as it increases statistical power and reduces the duration of the experiment. Some considerations:
Running concurrent, mutually exclusive experiments requires allocating a fraction of the user base to each experiment. On Statsig this is handled with Layers.
A smaller allocation may be preferable for high-risk experiments, especially when the overall user base is large enough.
Effect size
Determine the desired minimum detectable effect (MDE) for each primary metric that is critical for making a decision. MDE is the smallest metric impact we want to be able to measure if there is indeed a real effect caused by the experiment. Smaller effects are harder to detect, so think about your tolerance for missing a true effect: At what point is the effect too large to go unnoticed?
For metrics we want to improve: What’s enough of a lift to warrant shipping this change? Maybe a 1% lift in purchases is huge and we wouldn’t want to miss that. Or perhaps only a 10% + increase in clicks is worth shipping a more expensive model.
For guardrail metrics: The MDE should be the largest regression size you’re willing to miss and ship unknowingly.
Duration
Knowing the desired allocation, use power analysis to determine the required duration for the experiment as follows:
Use power analysis to determine the duration needed to reach the MDE for each the those primary metrics. If they yield different results, pick the longest one.
If the duration is too long to be practical, consider the following:
Increasing allocation, if possible.
Increasing the MDE. Perhaps we’re setting unreasonable expectations to measure very small effects, or not thinking big enough in terms of changes that can have a significant impact.
Choose different metrics. It’s common for experiments to have only a small impact on topline company metrics, which are difficult to detect. Other metrics directly tied to the change being tested may be more sensitive or show larger effects. Understanding whether or not improvements in these metrics eventually ladder up topline gains may require the use of holdout or backtests.
Finally, knowing the required duration,
set clear expectations for the time window that will be used in the readout. E.g.: The first 14 full days of the experiment.
Example experiment design document
Description In this experiment, we’re testing showing 4 items per row instead of 3. We know that many users don’t scroll down very much and believe that seeing more items on the screen will lead to more purchases.
Hypothesis Showing 4 items per row instead of 3 will increase add_to_cart event count
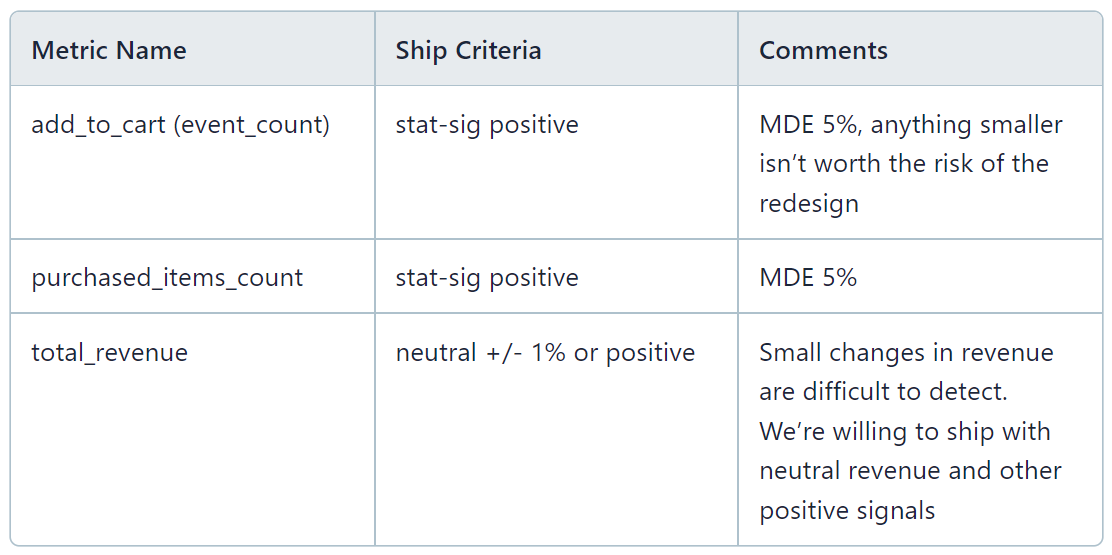
Primary metrics
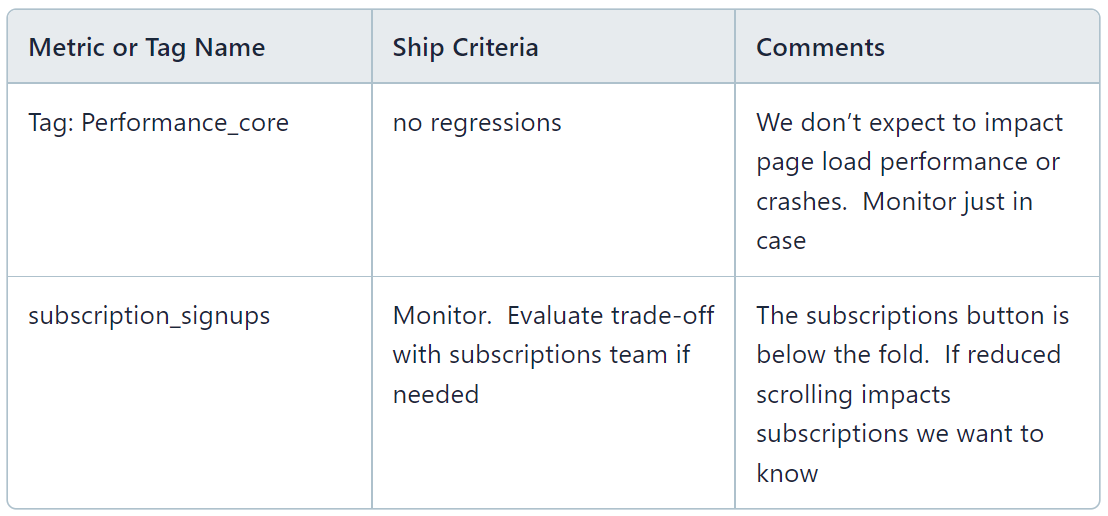
Secondary metrics
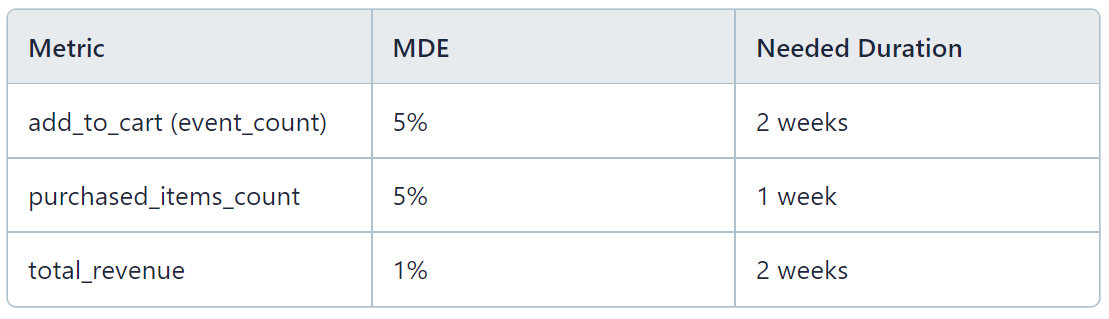
Power analysis
Allocation: 100%
Duration: 2 weeks
Analysis window: 14-day rollup starting on day 2 of the experiment
Step 2: Monitoring phase
Monitoring is important to ensure that the experiment is working as expected and that the test experience isn’t causing major regressions. Note that this is different from “peeking” with the intention of making a ship decision as soon as good stat-sig results are observed.
Metrics and exposures data will become available one day after starting the experiment. The following steps will help ensure that your experiment has valid data at the time of the readout and major regressions don’t go unnoticed.
Experiment health checks
These checks are available in the diagnostics page. They alert you of possible issues with the experiment setup that can impact the validity of the results.
Balanced exposures: Ensures the allocation of units to each experiment group matches the expected split. If not, this could signal a problem with the experiment setup and lead to invalid results.
Metrics have data: Experiment results can only be computed if the metrics have unitIDs that match the experiment exposures. This checks for matching unitIDs to ensure metrics will be available.
Monitor metrics with sequential testing
When sequential testing is enabled, the confidence intervals are adjusted to reflect the higher uncertainty that exists before the planned duration is reached. We recommend frequent checkins early on (after 1, 3, and 7 days) followed by weekly or bi-weekly checkins for longer experiments. These should be just a quick pass at the pulse results looking for the following:
Regressions in primary or secondary metrics. If a regression is stat-sig even with the sequential testing adjustment, investigate further. Look for other related metrics that are also impacted, check error logs and crash reports, etc.
Validation that the new experience is working as expected (when possible). Sometimes the test experience includes new events being logged or leads to drastically different user behaviors. In those cases, we look for evidence of these changes early on as validation that the experiment is truly testing the new experience.
When to make an early decision
For the most part, plan to run the experiment for the full duration stated in the experiment design. This will give the most statistical power across all metrics while maintaining the expected false positive rate.
The main reason for making an early decision is when a concerning regression is observed in a primary or secondary metric. If the regression is stat-sig even with the adjusted Sequential Testing confidence intervals, investigate immediately. If you find an issue that impacts the user experience, we recommend the following steps:
Terminate the experiment as soon as possible to limit the detrimental effect
Fix the issue
Restart the experiment. This will re-randomize the user assignment. While this may appear suboptimal, it’s the only way to ensure that the earlier buggy experience doesn’t bias the experiment results.
If the issue is only related to logging but has no user-facing impact, you may choose to follow the steps above. Alternatively, you may:
Keep the experiment live
Fix the logging
Reset the experiment duration to include the total number of days needed starting from the day when the logging is correct
Get a free account

Step 3: Experiment readout
When the experiment reaches the target duration, it’s time for a full analysis using the Pulse results. Select the desired date range for the analysis as outlined in the experiment design document (e.g.: last 14 days). Use the scorecard as the first level of evaluation, followed by deep dives into other metrics as needed.
Scorecard: Primary and secondary metrics
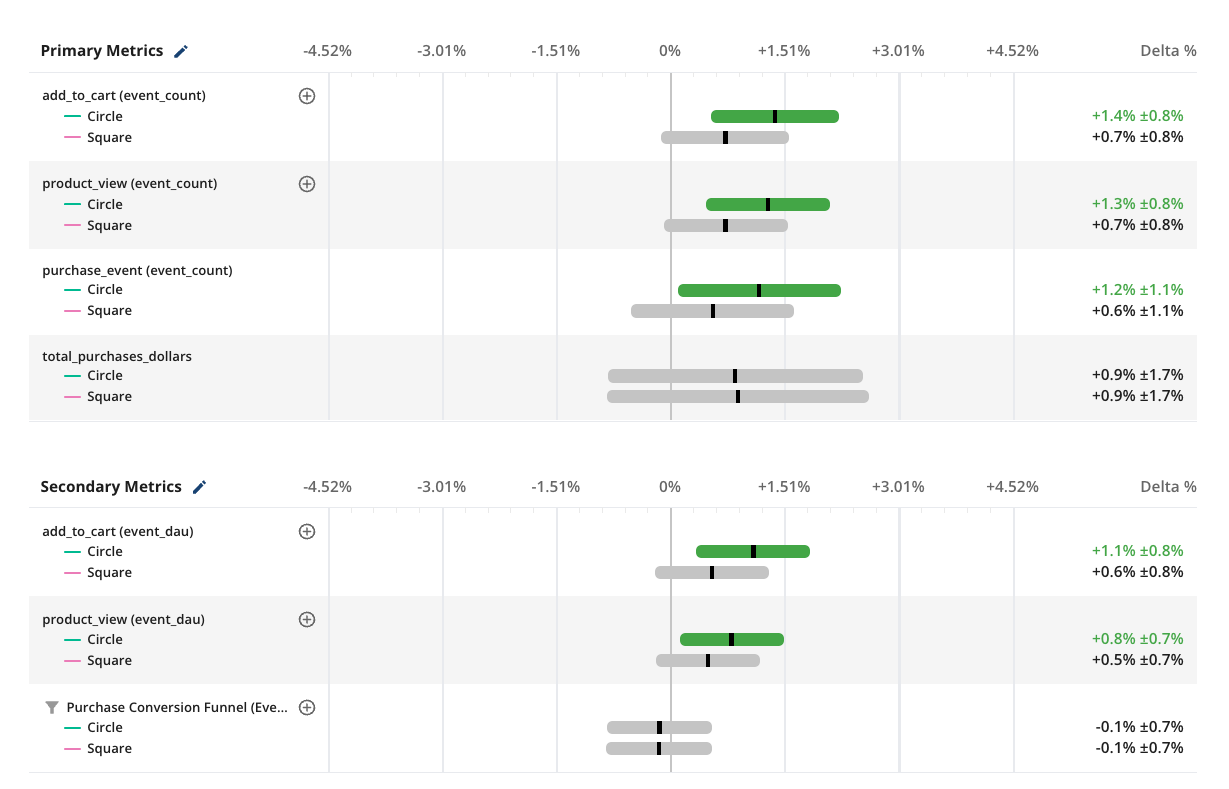
The Pulse scorecard shows the results for all the primary and secondary metrics, aggregated over the selected time window. In this view you’ll find:
Metric deltas: The relative (%) difference in the mean metric values between test and control groups.
Confidence intervals: These represent the uncertainty in the measurement of the metric delta. When the confidence intervals don’t overlap with zero the difference between test and control is considered to be statistically significant, denoted by a green bar (stat-sit positive) or red bar (stat-sig negative)
Evaluate the results
Compare the Score Card results to the ship criteria described in the experiment design doc for each of the metrics.
If all the pre-stated criteria are met, the experiment can be shipped.
If some of the “monitoring” metrics have regressions, then the trade-offs need to be evaluated. Ideally, some guideline already exists, such as “Up to 1% regression in subscriptions is acceptable for every 1% lift in purchased_items_count”. Otherwise, this can be handled on a case-by-case basis with a deep dive into the relevant metrics.
If the launch criteria are not met, the experiment should not be shipped.
Using the all metrics tab
The “All Metrics Tab” gives access to other metrics that were not included in the scorecard. This is helpful for identifying unintended consequences of the experiment or better understanding what’s causing the movements in the scorecard metrics.
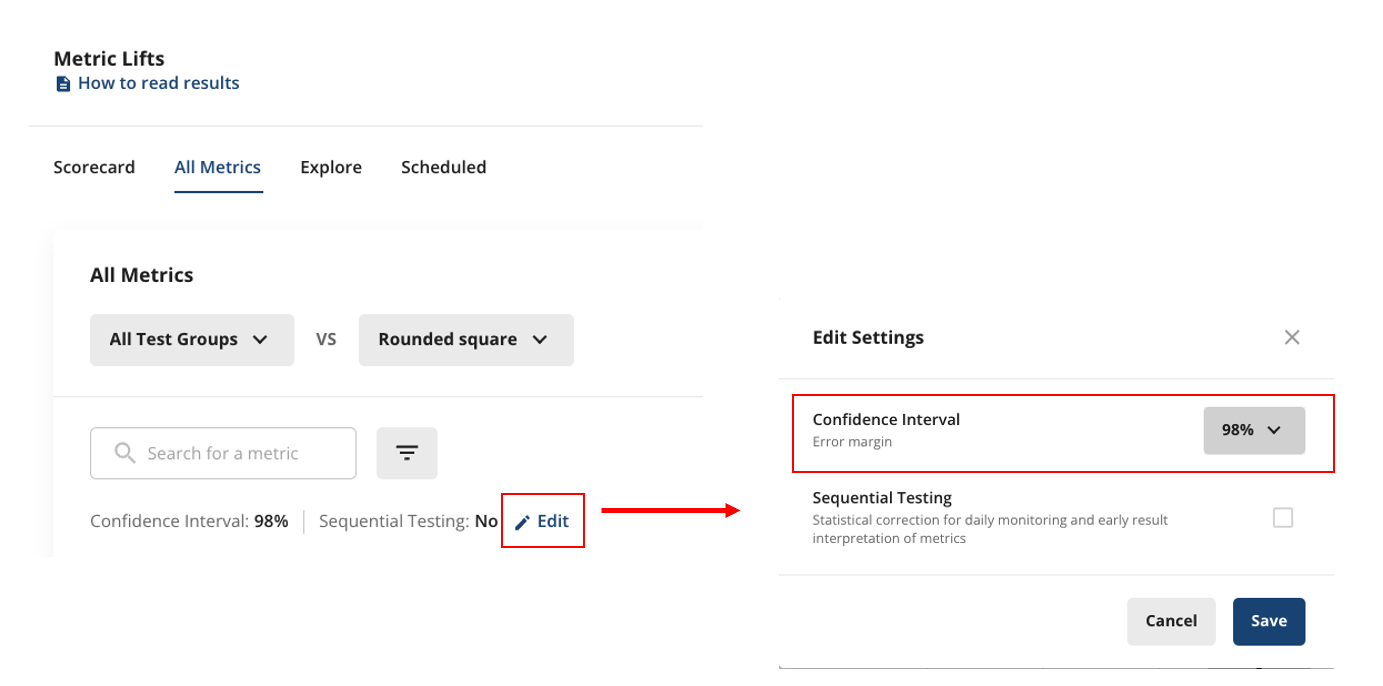
A word of caution: There’s always a risk finding false positive results, meaning a metric can be statistically significant even if there is no true effect caused by the experiment. The False Positive Rate is determined by the significance level we select. When using 95% confidence intervals, on average 5% of metrics that have no true effect will appear stat-sig. Some steps to better control for false positives:
Use 98% confidence intervals for metrics that are not expected to move.
If we can’t come up with a logical explanation for an observed stat-sig result, it’s quite possible that it’s a false positive.
Be careful to treat both positive and negative results equally:
If we dismiss regressions in unrelated metrics as noise because they don’t have a plausible explanation, we should do the same for unexplained improvements.
If we choose to ignore regressions that are neutral with 98% CIs even if they are stat-sig at 95%, we can’t claim similar gains in unrelated metrics that are stat-sig at 95% but not 98%.
Request a demo

Evaluating ratio metrics
Ratio metrics require extra attention. It’s possible for the overall value of the ratio to move in a direction that is opposite to the change in the absolute numerator and denominator values. It’s always good practice to check the numerator and denominator separately to understand the true effect. To see this, click the + next to the metrics to view the component breakdown.

Consider for example a purchases per session metric:

Assume we have the following data from an experiment with the same number of users in each group:
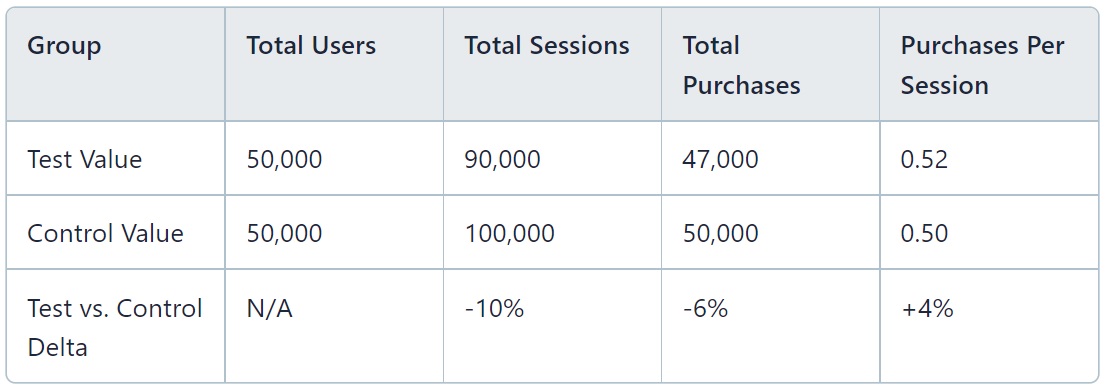
Purchases per visit is 4% higher in the test group than the control group. This would look like a good result in the scorecard.
But the test is actually detrimental to the user experience, causing a 10% drop in sessions and a 6% drop in purchases. If we only look at the ratio, we would miss this drop. If we care about total purchases we don’t want to ship this experiment
Learn from the pros
