Products
Solutions
Resources


In 2021, we ‘took the swing’ and hit—establishing Statsig as a leader in the emerging world of product experimentation.
In 2022, we dug deeper, doubling down on our core product, expanding the suite of tools we offer, and bringing more people (customers, employees, investors, and partners) on board.
Of all the ‘wins’ we had this year, the greatest was seeing early Statsig customers “get it” and switch from ‘walking’ to ‘running’ in their experimentation practices. We were founded on the belief that a strong culture of experimentation is fundamental to product growth and success.
When our customers see the value of experimentation firsthand, it is tremendously inspiring—for our customers, our team, and our investors. Our conviction that every builder should have access to the best possible tools remains unchanged.
That conviction is what keeps our team going, and in April, it paved the way for us to close our Series B in a round led by Sequoia Capital, with participation from Madrona Venture Group. With this round, we’re set to continue building incredible tools for years to come!
Doubling down on (a culture of) experimentation
We know that having a tool is not enough for people to become successful experimenters, and in particular, it’s not enough for companies to become successful experimenters at scale. The cultural component of experimentation is often overlooked—Vineeth explored what it's like to democratize experimentation, and what that looks like at companies like Airbnb, Spotify, Facebook, Uber.
But a blog post isn't enough. We believe that we shape the tools, but the tools shape us.
So we started building features to help people communicate their hypotheses, codify primary and secondary metrics, experiment duration, and more. These encourage customers to record key parameters for all experiments—when experimental design choices were made, the state of metrics at that time, which group shipped that experiment, and more—helping everyone across an organization learn from all experiments.
We also added a suite of tools to enable deeper collaboration. You can use in-product discussions to codify the context people had at each step of their experimentation journey. To help people find and organize their Feature Gates, Experiments, and Metrics, we added tagging across all configurations and advanced search functionality.
We even added a home feed to show you recent updates across your project, and allow you to catch up on feature launches, experiment decisions, and top-line metric movements all in one place.
And we ended the year by adding Dashboards. These are a powerful tool to customize your view into the metrics you care about—related to an experiment or otherwise. With these improvements, the Statsig platform is not only a set of experimentation tools, it’s an organizational log book that ties metrics and features together and allows anyone to make an entry.
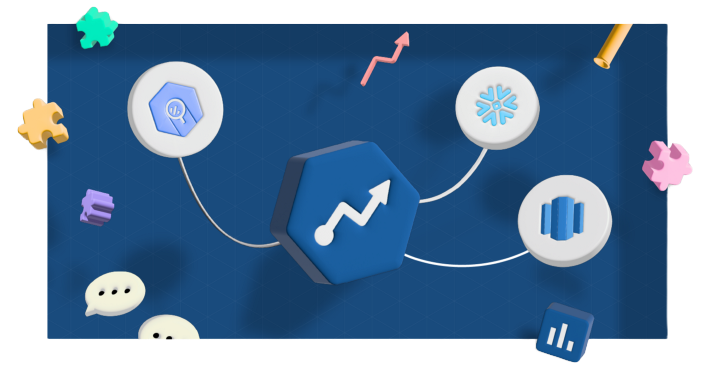
Bring your tech stack…and your data warehouse
We believe experimentation should work for everyone, so this year we worked hard to expand the technical stack that Statsig supports. Not only did we ship SDKs for flutter, unity, php, and rust to help product builders in those communities, but we also expanded Statsig to integrate directly with data warehouses that were existing stores of metric and event information for Statsig customers.
Firing on all cylinders
Whether you’re integrating with one of our new SDKs, or using Statsig with your data warehouse, we’re continually improving our stats engine. Most recently, we gave our customers CUPED automatically for their primary metrics, and added Sequential testing to help account for recency bias.
Our custom metrics feature already gives you the power to create custom metrics in a simple UI, but we expanded it to support composite, event user, event count, and max event user metrics. Earlier in the year, we revamped the power analysis calculator with our stats engine and added 99.9% winsorization.
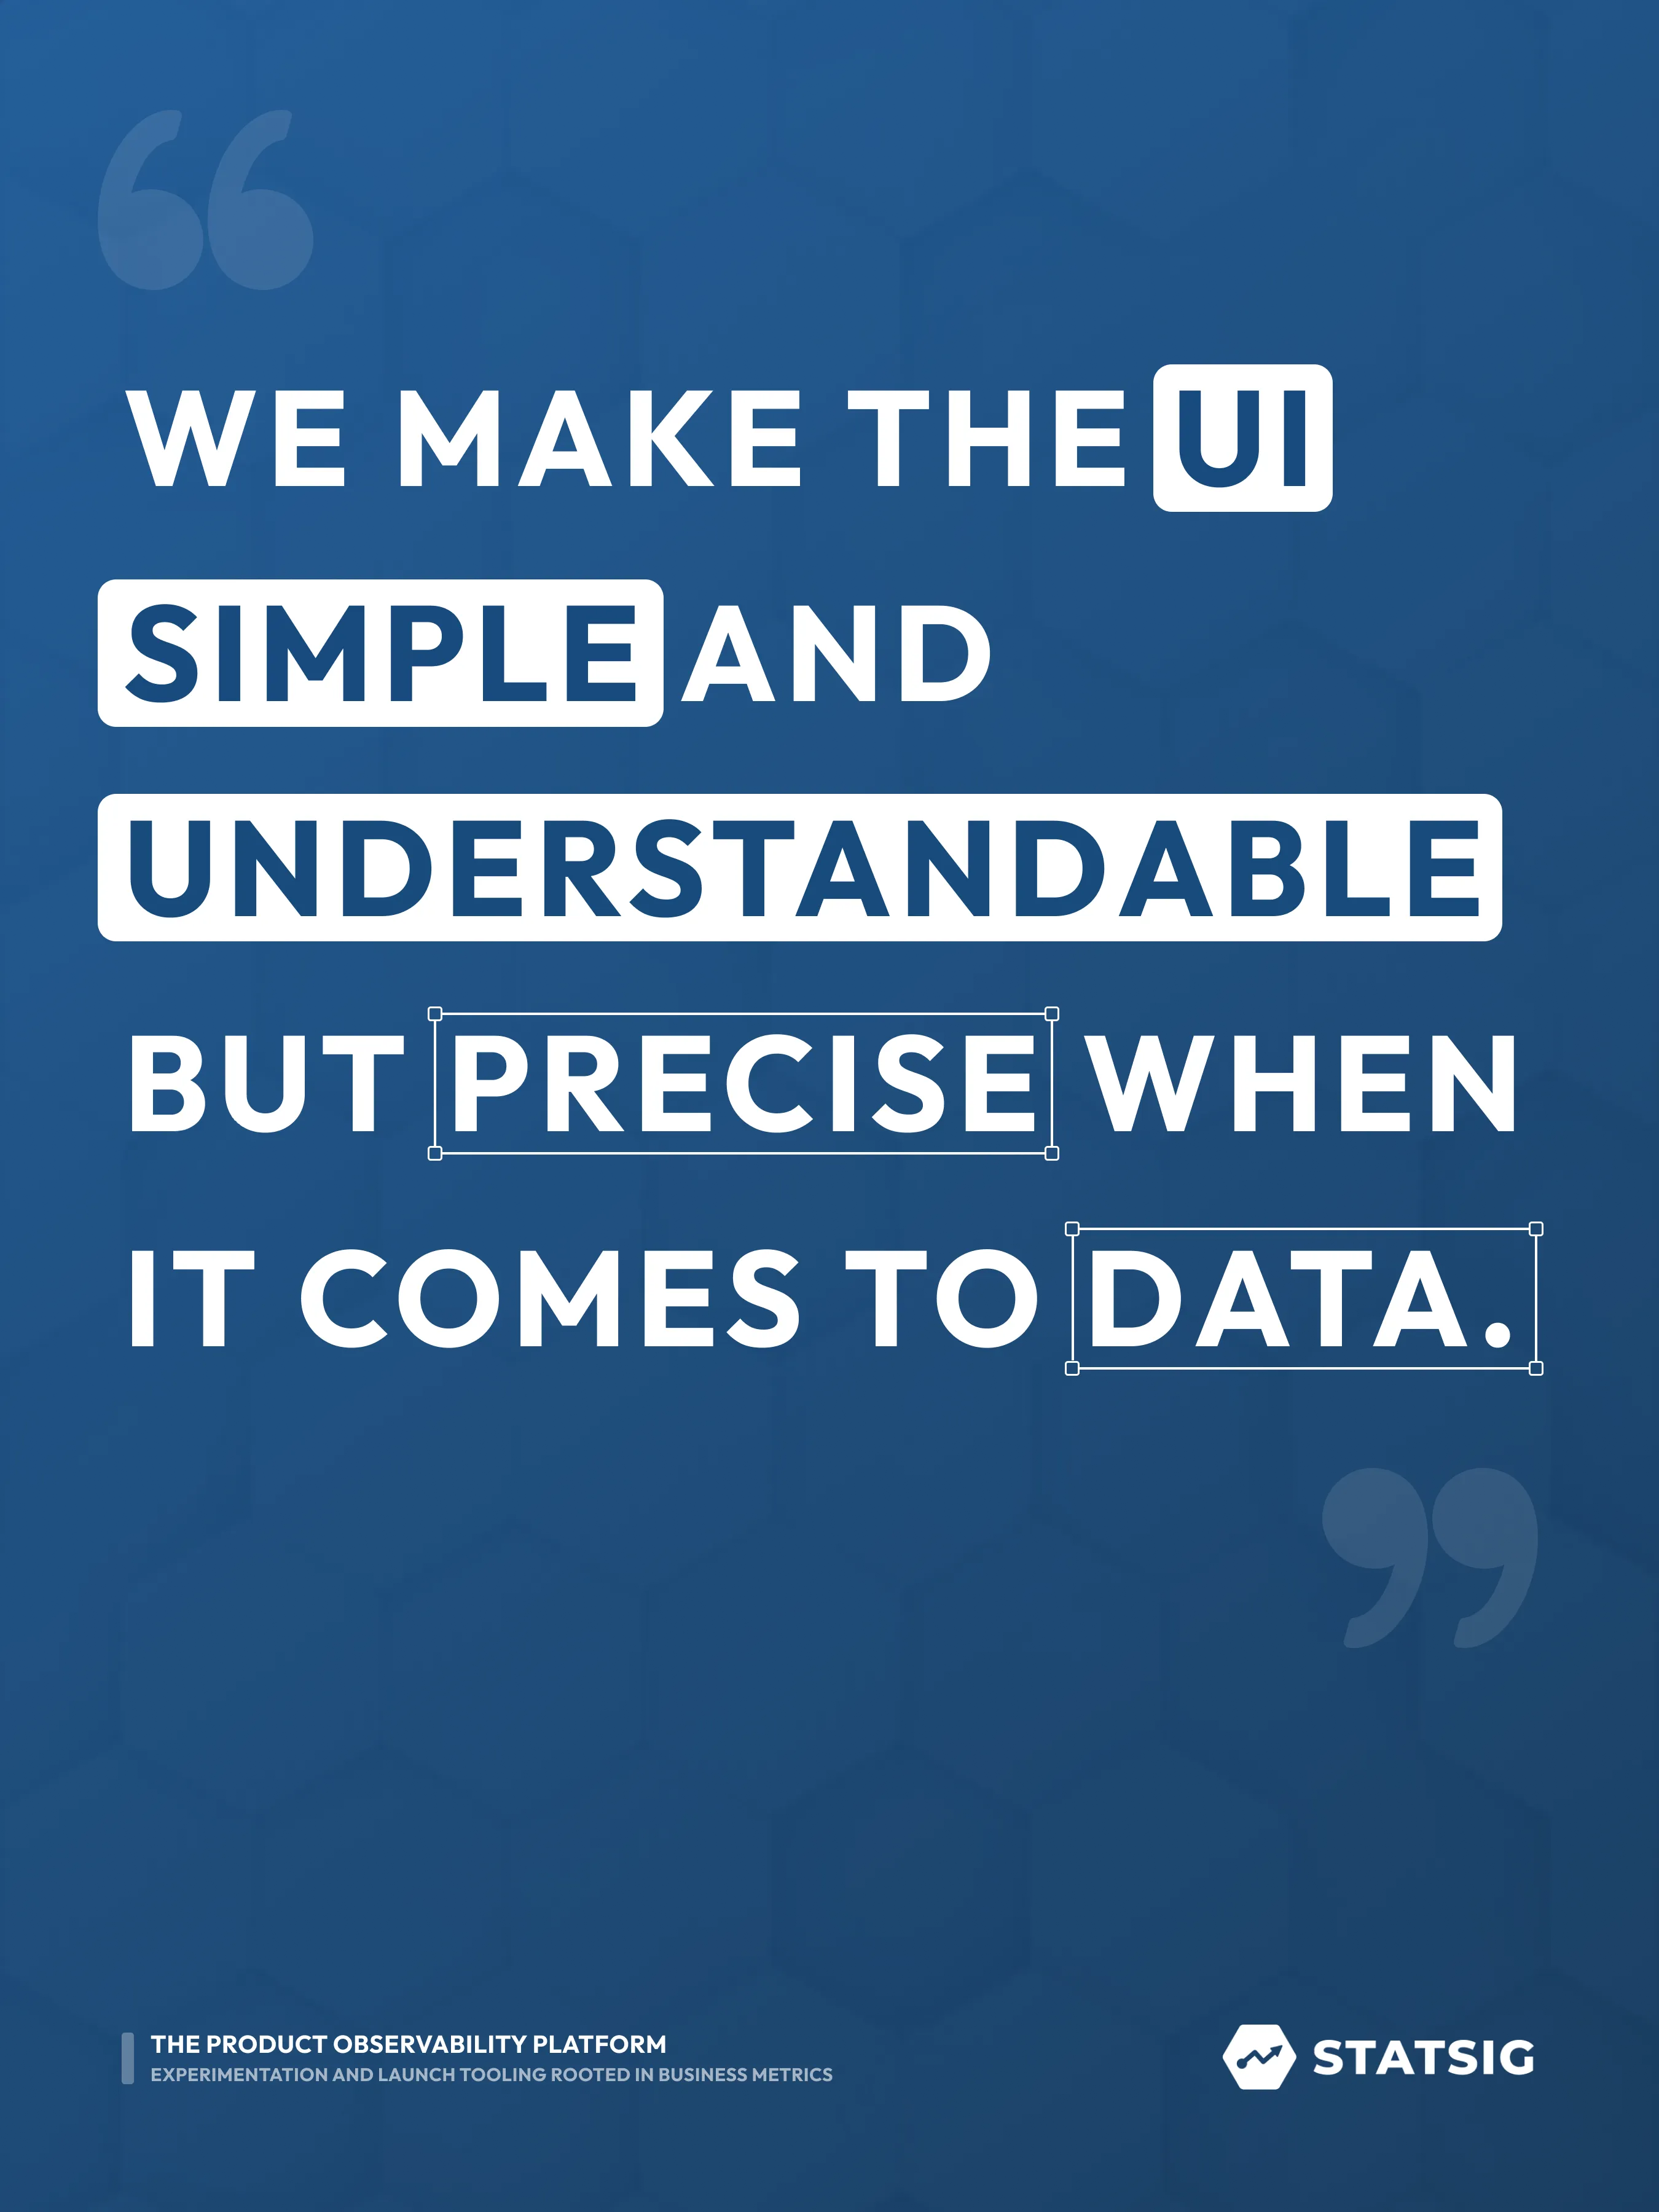
And yet, with all of the complexity that these different statistical methods can introduce, we’ve been strategic in how they are added in the Statsig console. Making these features accessible is a top priority for us, which is why we place extra emphasis on making the UI simple and understandable, but precise when it comes to data.
Our stats engine is firing on all cylinders and always getting better: It’s ready to churn through any event data and help you make sense of which features are moving key metrics.
New year, new blog!
And finally, you’re reading this on our brand new blog! GB wrote our last medium post, a meta blog post about the tradeoffs between a self-hosted and a medium blog. We’ll see you in 2023, right here at www.statsig.com/blog.
And while it’s impossible to explain all of these improvements in detail for this year in a review post, you can always join our slack channel to keep up to date with launch announcements in real-time.
Join the Slack community

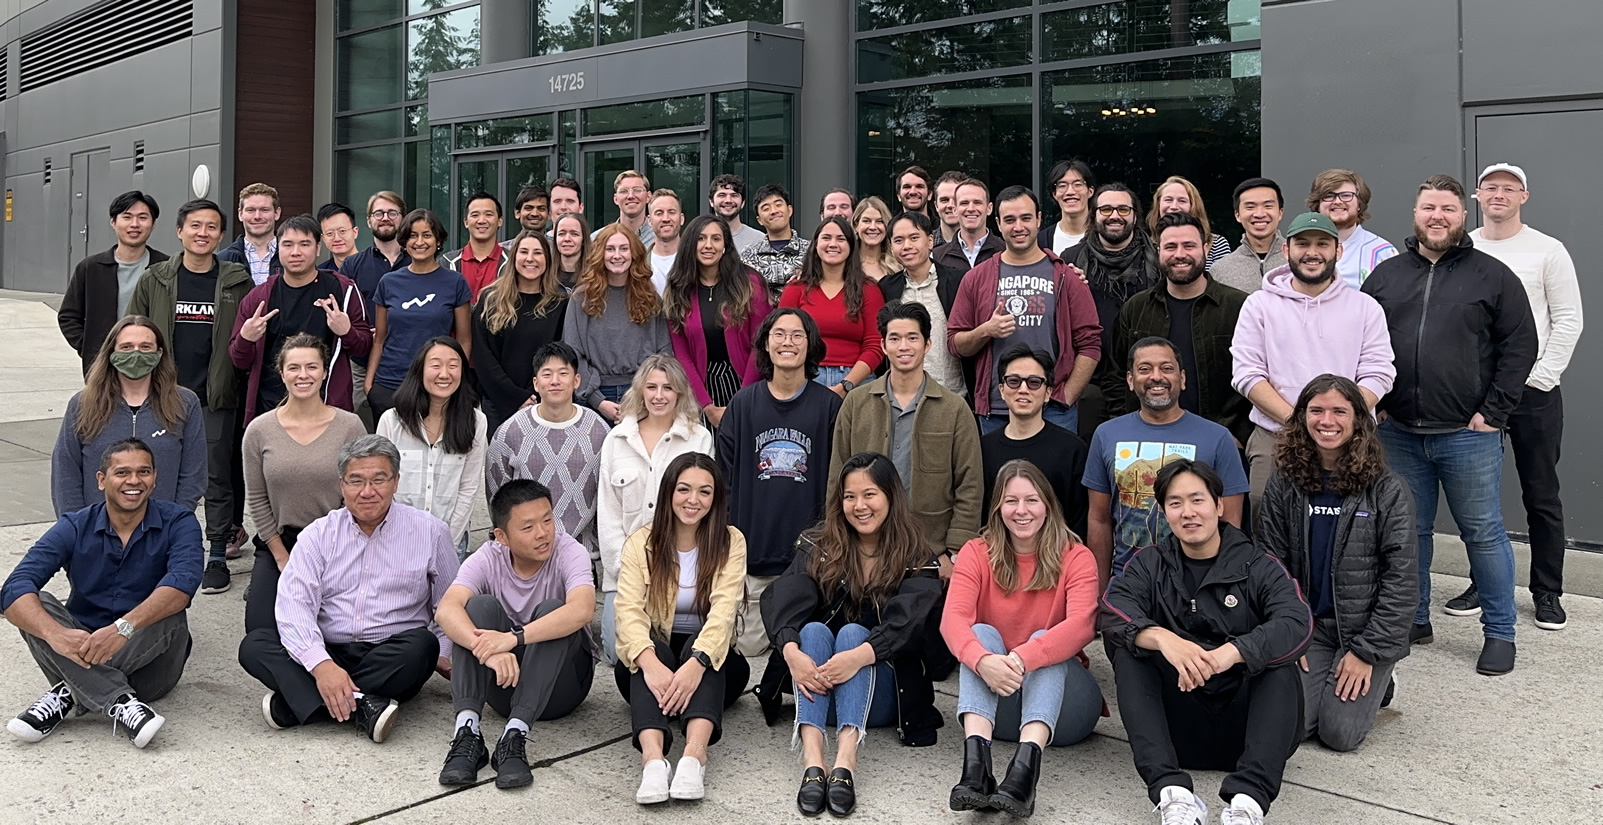
From all of us at Statsig, thanks for digging deeper with us in 2022.
We wish you many statistically significant results in 2023!