Products
Solutions
Resources
Product Updates

Github AI Integration
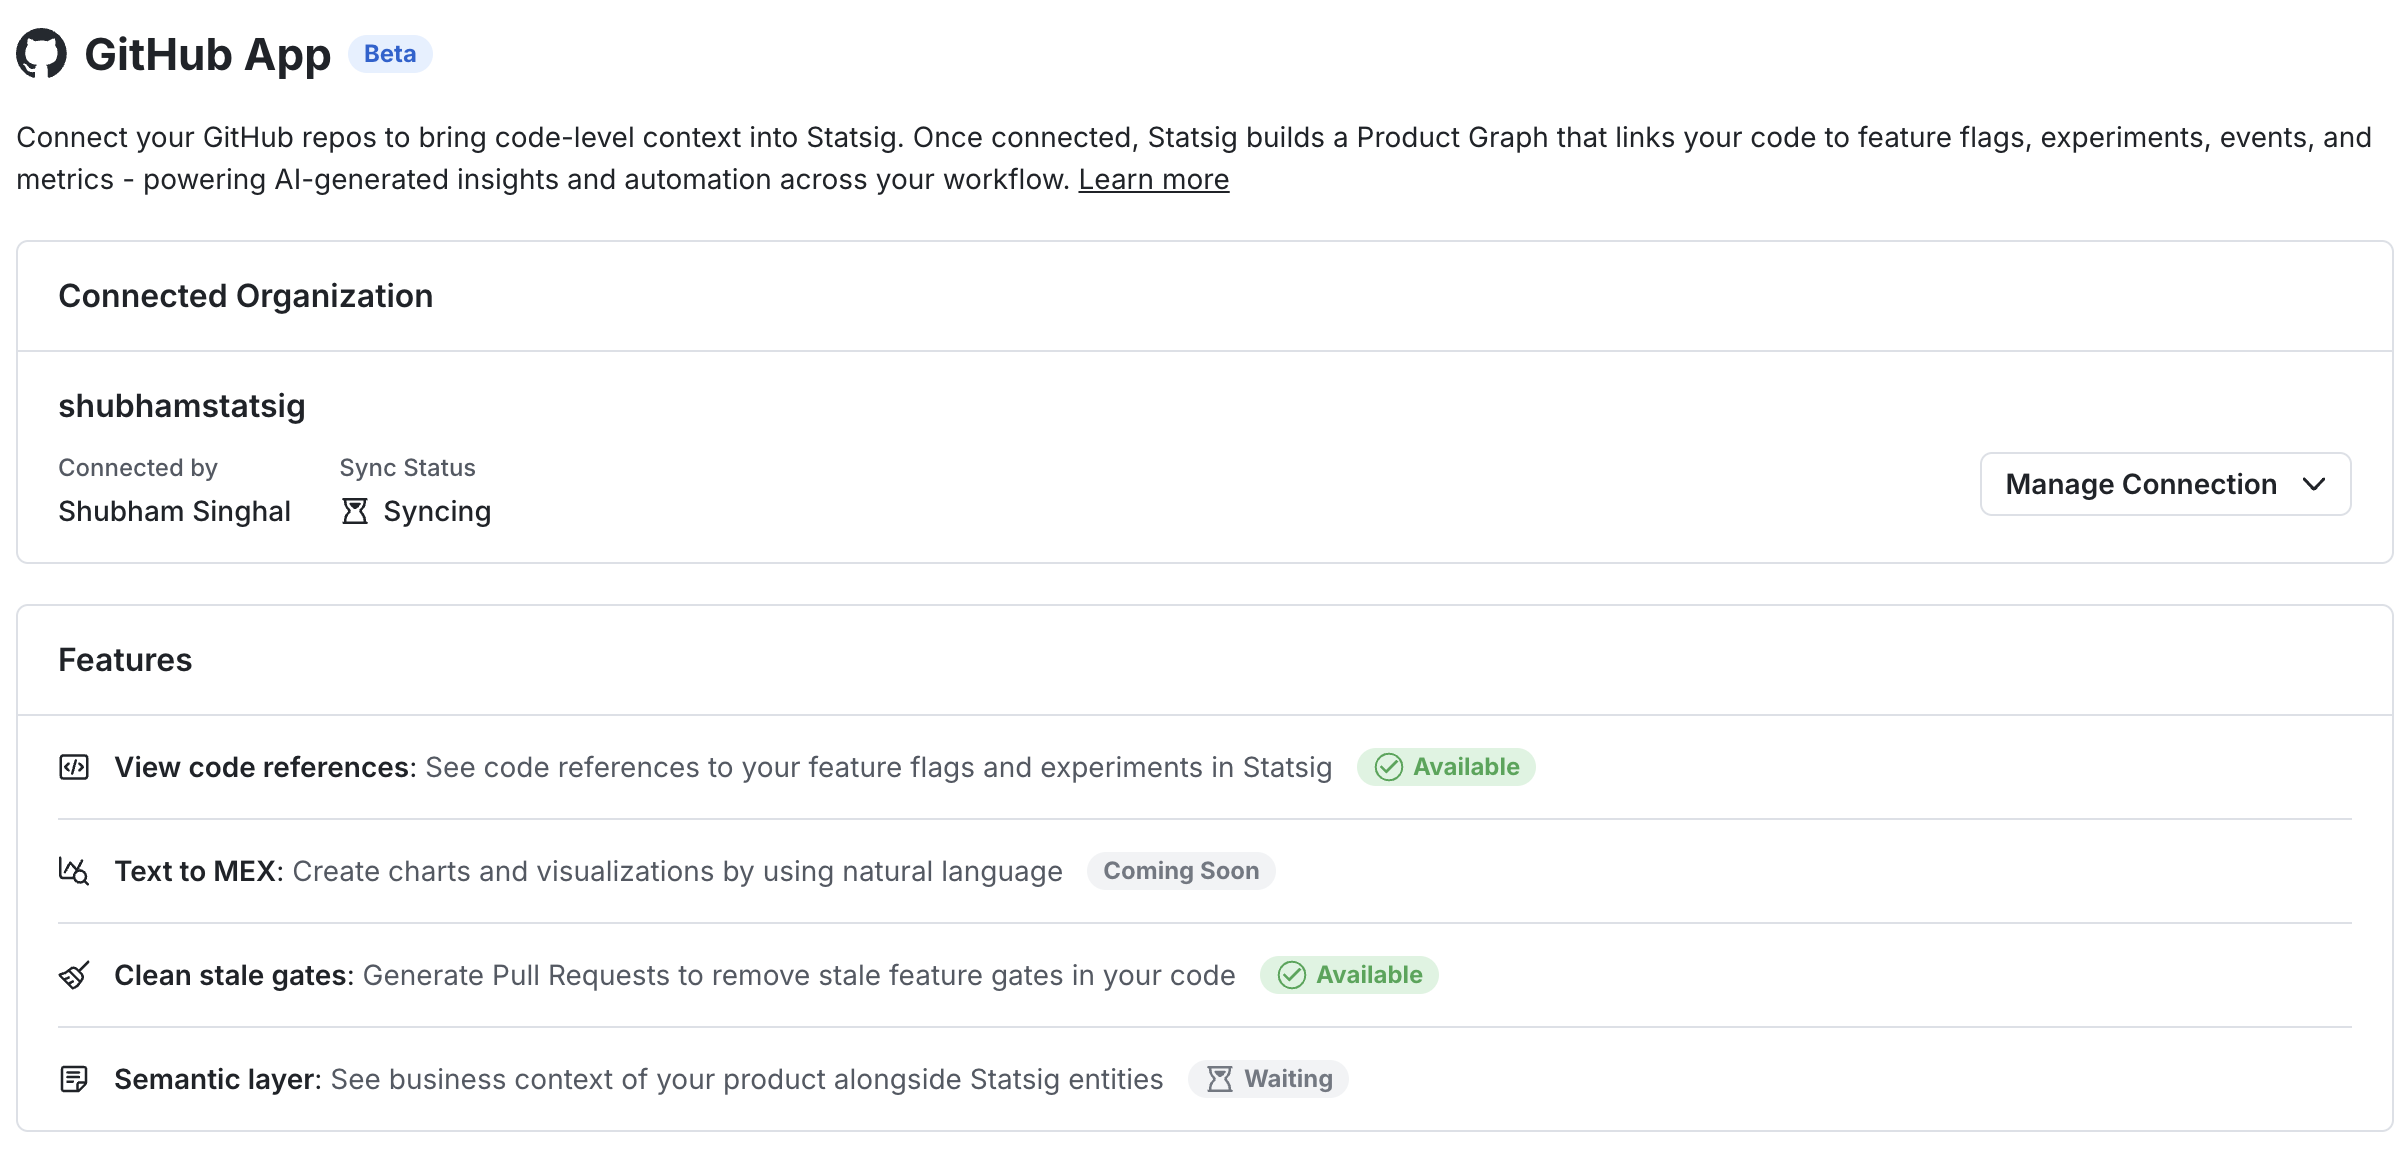
We’ve launched a new GitHub AI Integration that connects Statsig directly to your codebase. This is a foundational capability that powers a growing set of AI features across Statsig console.
Why this matters
Through Github connection, Statsig understands where flags, experiments, and metrics live in your code. We then build a Knowledge Graph which maps relationship between code and Statsig entities. Once GitHub is connected, Statsig becomes "code-aware." This unlocks workflows that weren’t possible before, tying product insights directly back to the code that shipped them:
Contextual Descriptions: AI-generated descriptions that understand code context behind each metric, flag, and experiment. Quickly understand what each entity in Statsig does and why it exists.
Stale Gate Cleanup: One-click workflow to generate PRs to remove stale feature flags directly from Statsig console
Metric Explorer Co-pilot (Coming Soon): Describe what you want to analyze in plain English and Statsig creates a chart with the right events, metrics, and breakdowns.
Getting started
To use this integration, navigate to Settings -> Integrations -> Github App page in your Statsig console. Authorize with your Github credentials and install the app on your desired repos. Please contact your Github Org admin to install Statsig App to use the above features! Read more here: https://docs.statsig.com/integrations/github-ai-integration
Contextual AI Descriptions
Bring your code context to automatically generate human-readable descriptions for feature gates, experiments, metrics, and events. Pre-requisite: This feature is powered by Statsig's new Github AI Integration.
Why this is valuable
We have observed that many Statsig users have empty descriptions for their entities (feature gates, metrics, experiments, etc.) in Statsig. This is despite users knowing that good descriptions are super useful in understanding the purpose of any entity.
Statsig AI can understand the meaning behind each feature gate, experiment, event, and metric from the code references that power these entities. As a result:
Anyone viewing a gate or experiment can quickly understand what it does and why it exists
In Metrics Explorer, users can see the semantic meaning of events and metrics, not just raw names
This dramatically improves self-serve understanding for PMs, engineers, and new team members.
How this works
If you empty description, Statsig will automatically pre-fill description fields with AI-generated context.
If you already have a description, Statsig will show an AI suggestion that can be more richer in context.
🔎 Global Filters in Funnels
Funnels now support Global Filters. Global Filters apply across the entire funnel, so you can set shared constraints once instead of repeating them across steps.
What You Can Do Now
Apply a single set of filters to all steps in a funnel
Filter funnel results using additional artifacts, including:
Experiments (for example, only users in a specific experiment or variant)
Segments
Holdouts
ID list based segments
How It Works
Use the Global Filters section in the funnel builder to define who should be included in the funnel analysis.
Global Filters apply to every step in the funnel.
Example use cases:
Experiment analysis: Show funnel conversion for users in Variant B of an experiment.
Segmented funnel: Restrict the funnel to a specific Segment (for example, “Power users”).
Holdout-aware reporting: Exclude users in a Holdout to avoid mixing test and control populations.
Targeted cohorts: Use an ID list based Segment to analyze conversion for a specific account list.
Impact on Your Analysis
Keep funnel results consistent across steps by applying shared constraints once
Reduce setup time when iterating on funnel definitions
Make it easier to compare funnels across experiments, segments, and holdouts without reworking step logic
Global Filters make it faster to build funnels that match the exact population you want to analyze, especially when your audience is defined by experiments, segments, or holdouts.
🧭 Warehouse Explorer
Overview
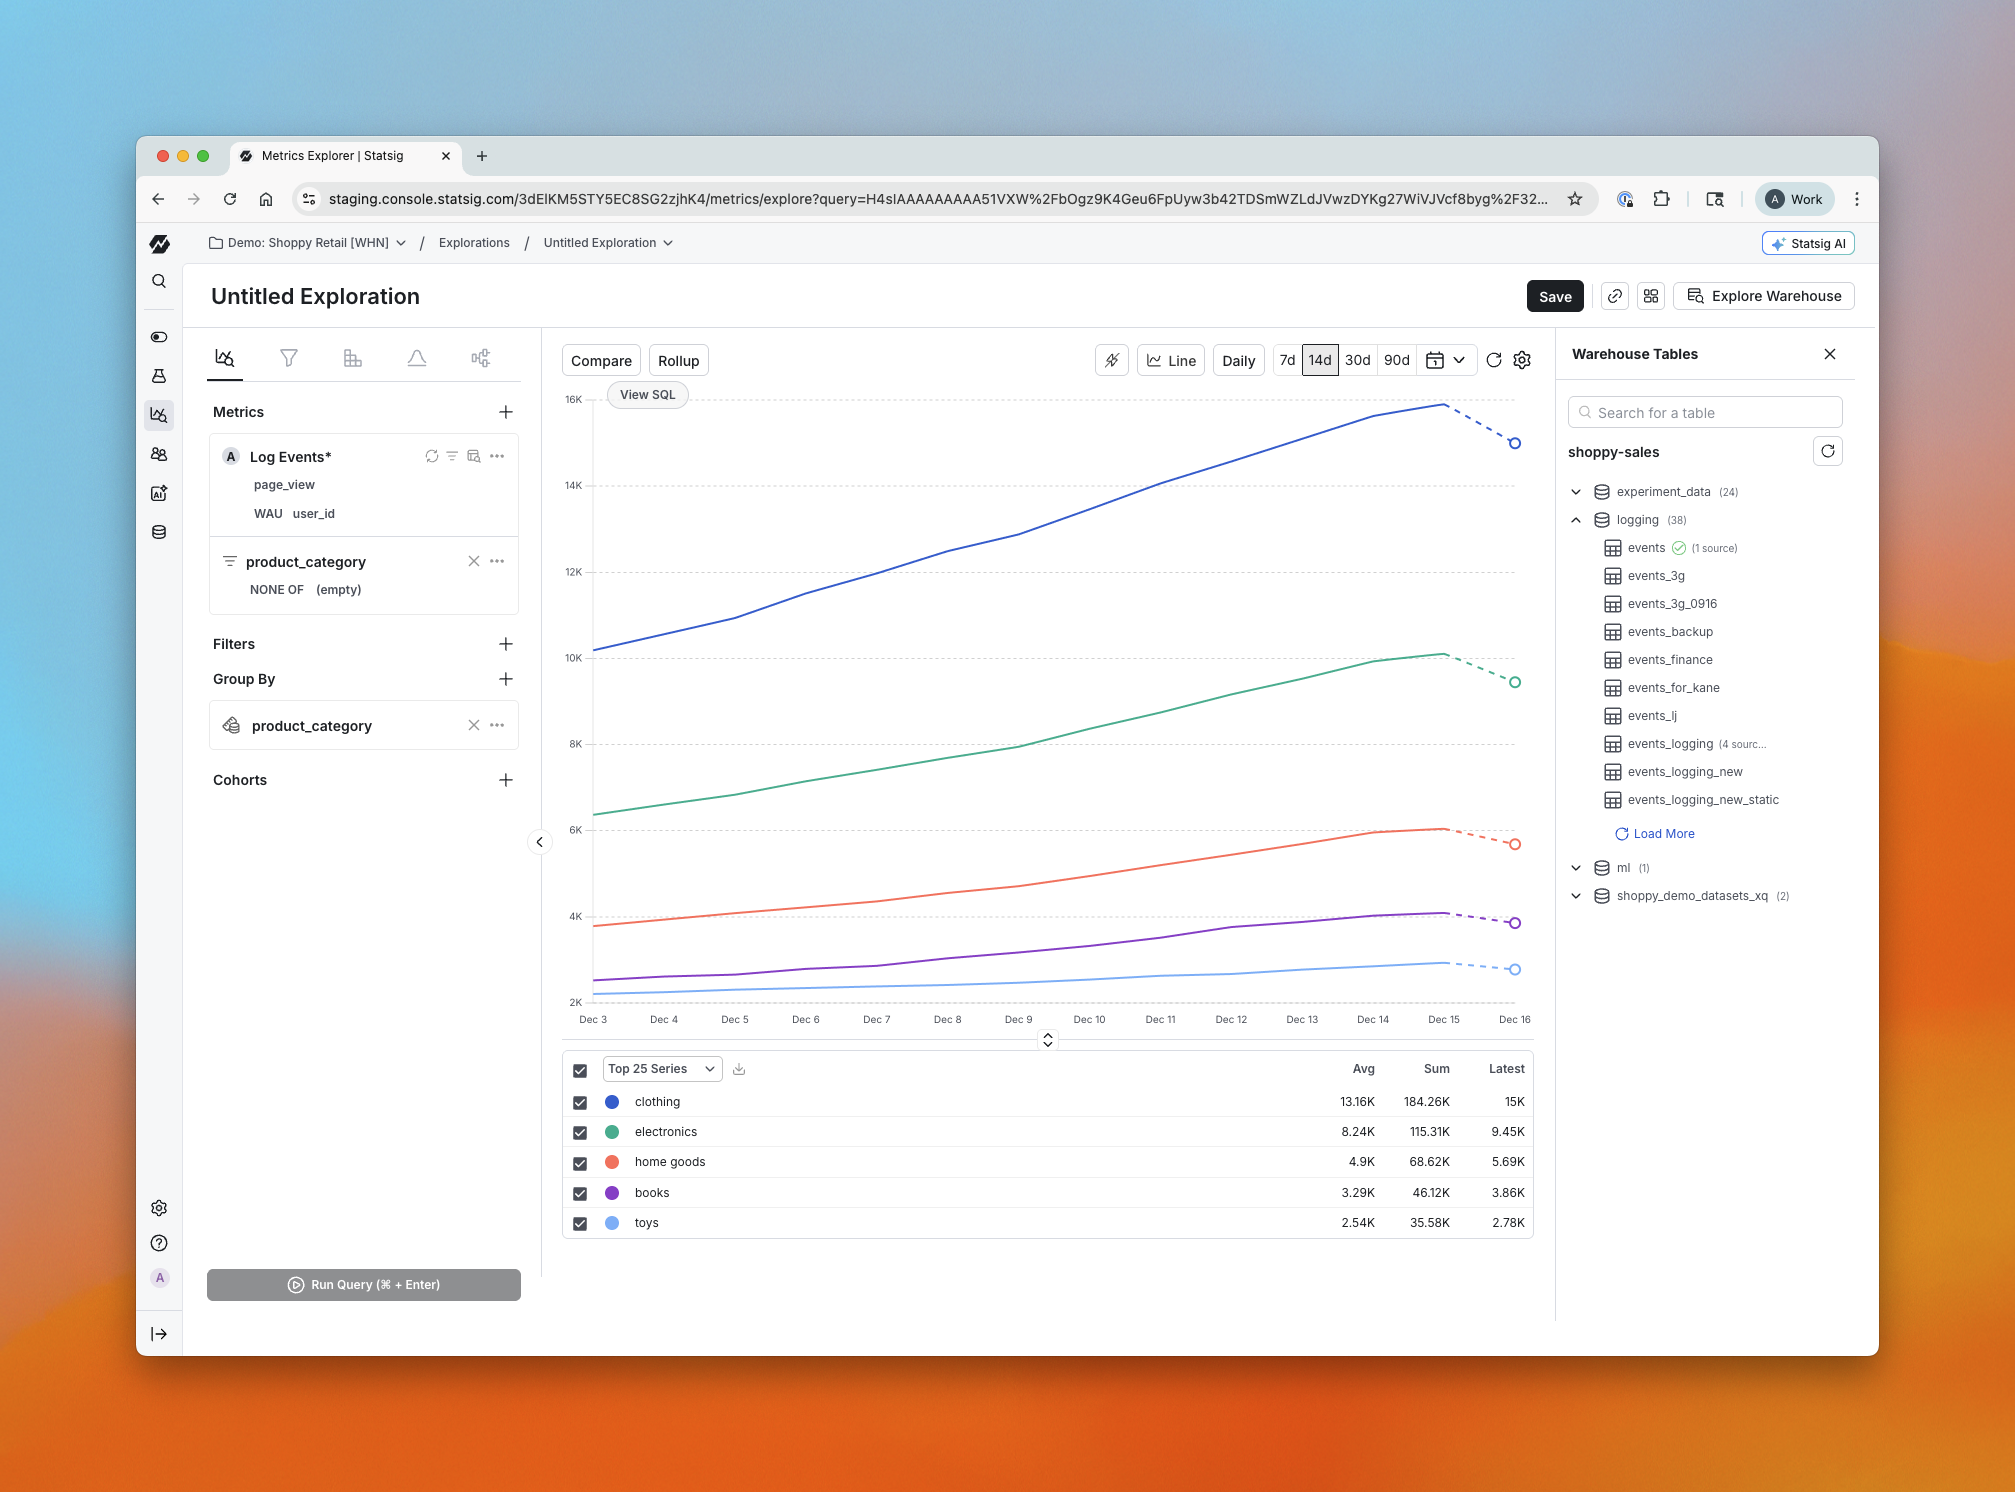
Warehouse Explorer makes it easy to bring warehouse data into Statsig, without needing to know the “right” table upfront. Previously, if you wanted to analyze warehouse data in Statsig, you had to know the name, location, and schema of the table and configure a metric source for it. Now, Metrics Explorer includes a visual browser for your warehouse projects, folders, and tables so you can discover what you need first, then add it for analysis. This is a new capability and is only available for Warehouse Native customers.
What You Can Do Now
Browse your warehouse projects, folders, and tables directly in Statsig
Click into any table to quickly understand what’s inside:
Column names
Sample values for each column
Per-value row distribution metadata (what percent of rows each value represents)
Bring a table into Statsig for analysis in a few clicks:
Name the source
Provide light configuration (for example, whether it’s an event-based table)
Build self-serve visualizations from warehouse data faster, like:
Funnels from GA4 tables
Exploring Stripe data without manual setup work
How It Works
Open Metrics Explorer and browse through your warehouse projects and folders.
Select a table to preview its schema, sample values, and distribution metadata.
When you find the table you want, name it and complete a small amount of configuration (for example, mark whether it’s event-based).
Start analyzing the table in Statsig right away.
Impact on Your Analysis
Faster time to first chart because you can discover tables inside Statsig instead of tracking them down elsewhere
More self-serve exploration for teams with lots of warehouse datasets
Easier setup for common workflows like funnels and business-data analysis
Warehouse Explorer is available today for all Warehouse Native Analytics customers.
🧩 Segment Filters on Dashboards
We’ve expanded Global Dashboard Filters so you can filter a dashboard using ID List based Segments. This is an additional filter option. Existing global filtering (property filters and other criteria) continues to work the same way.
What You Can Do Now
Apply a Segment filter at the dashboard level where the segment is defined by an ID list
Combine an ID List Segment filter with your existing global property filters
Keep every chart on the dashboard scoped to the same audience without reapplying filters chart-by-chart
How It Works
Create or select an ID List based Segment (a segment defined by a fixed list of IDs, like user IDs, account IDs, or device IDs)
In your dashboard’s Global Dashboard Filters, choose that segment as a filter
The segment filter applies to all charts on the dashboard, alongside any other global filters you’ve set
Example: set the global filter to the segment “Enterprise accounts (ID list)” to ensure every chart reflects only those accounts.
Impact on Your Analysis
Use dashboards to answer questions about a specific, known set of users or accounts (for example, a customer list, beta cohort, or internal test group)
Reduce chart-to-chart inconsistencies caused by manually recreating the same ID-based audience filter
Iterate faster when you need to swap the audience across the entire dashboard (for example, compare two different customer lists)
📊 Session Analytics on Warehouse Native
You can now run Session Analytics on Warehouse Native data, as long as you are also logging events with the Statsig SDK. This is a new capability for Warehouse Native and does not replace any existing session analytics workflows.
What You Can Do Now
Analyze user sessions directly in Warehouse Native
Use Metric Drilldown charts to answer session questions like:
How many daily sessions are occurring?
What is the median (p50) session duration?
How does session duration vary by browser, device, or other properties?
How It Works
A session is defined as a period of user activity followed by at least 30 minutes of inactivity. Session Analytics uses a special statsig::session_end event, which includes a property for session duration in seconds. You can use this event in Metric Drilldown charts to slice, group, and compare session metrics.
This is supported only for customers who:
Use Warehouse Native
Log events with the Statsig SDK (so statsig::session_end is available)
Impact on Your Analysis
Run session-level metrics alongside your warehouse-native metrics without needing a separate session pipeline
Measure engagement using session counts and duration with the same segmentation and breakdowns you already use in Metric Drilldown charts
If you are already on Warehouse Native and logging with the SDK, you can start using Session Analytics right away.
🔐 OAuth Support for Statsig MCP Server
We’ve upgraded authentication for the Statsig MCP Server to support OAuth — supplementing the previous key-based authentication flow. This brings a more secure, scalable, and standards-aligned approach to connecting your MCP tooling with Statsig.
Why this matters
OAuth makes it easier and safer for teams to integrate the Statsig MCP Server with their development workflows and in more tools. It enables clearer permission boundaries, smoother onboarding and persistent sessions, and better alignment with modern enterprise security practices.
Getting started
Follow the updated setup instructions in our docs to enable OAuth for your MCP Server connection. No changes are required to your existing Statsig feature flags or experimentation setup — just update your authentication method to take advantage of the new flow.
Learn more in the docs here: https://docs.statsig.com/integrations/mcp
🕵 Traces Explorer now in Beta
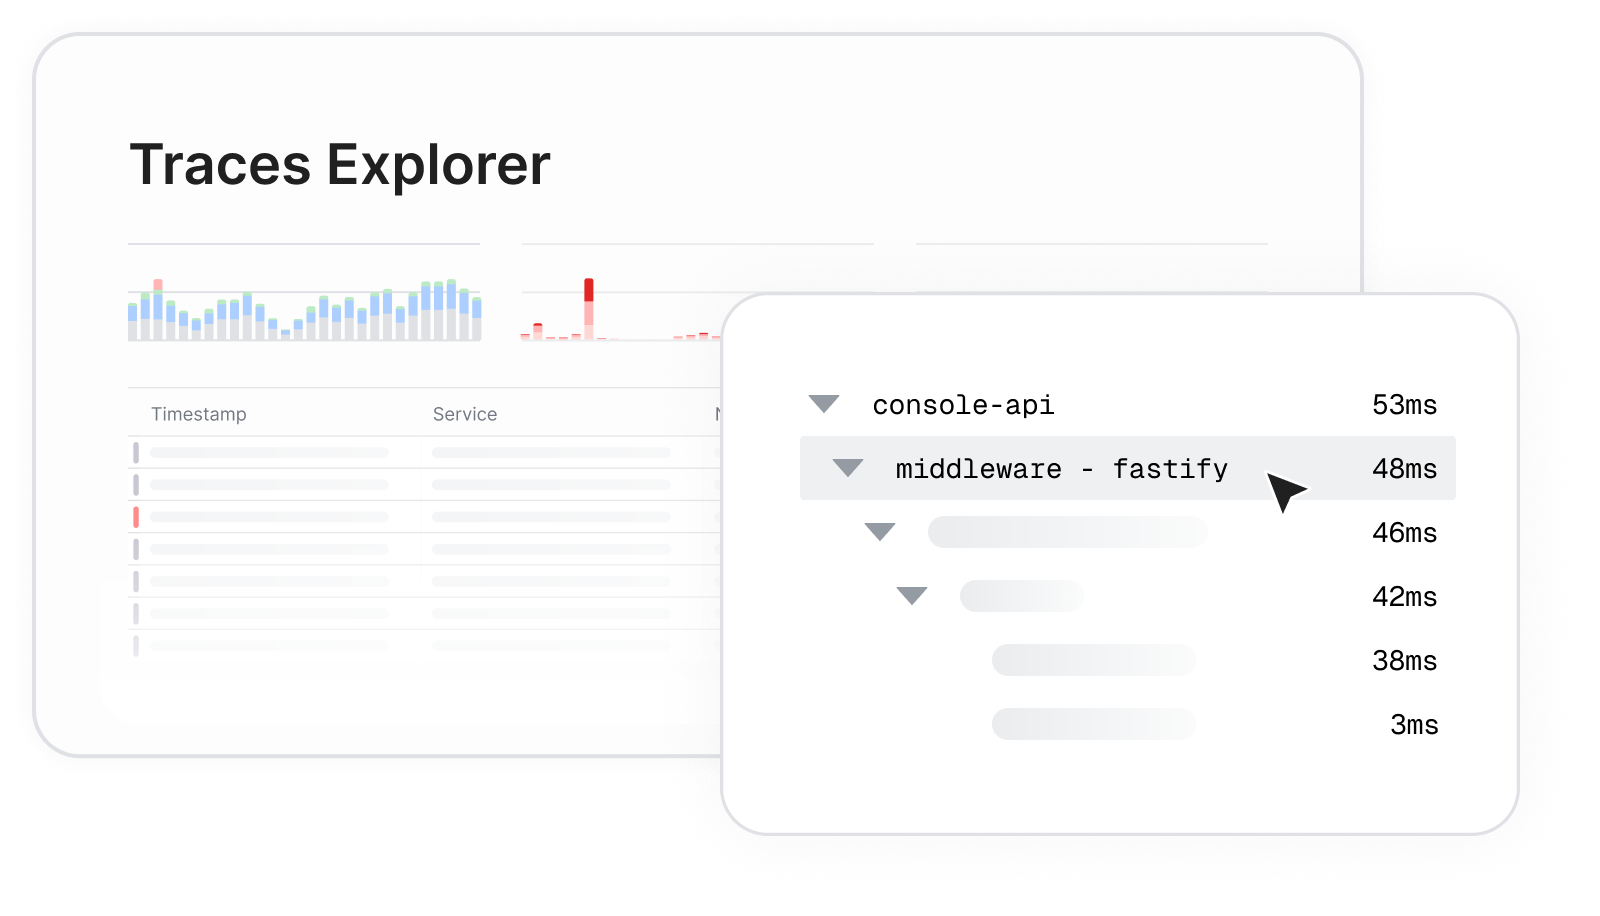
Traces show how a single request moves through your system, one step at a time. Statsig new lets you explore those spans alongside experiments and feature rollouts.
Traces Explorer = faster root cause. You no longer need to jump between tools to understand slow or failing requests. Statsig brings traces, logs, metrics, and alerting into one place for critical launches.
Bring observability into your product decision loop.
Traces Explorer (Beta) is available for Cloud customers. View trace setup instructions here.
🔌 Reverse Power
What is Reverse Power?
It shows the smallest effect size your test had power to detect based on actual sample size and standard error of the control group (it does not depend on the observed effect size of the experiment). It’s a great tool to leverage retrospectively near the end of an experiment to make more informed decisions.

How is it used?
Helps you reflect on what your experiment actually could detect
Helps you with iteration decisions like extending the experiment, rerunning with greater sample, or re-evaluating the experiment design
Getting started
Toggle it on/off anytime in Settings → Product Configuration → Experimentation. To learn more about Reverse Power see our docs here.
🕳️ Results in Lower Environment
For our Cloud users, we’ve added support for viewing cumulative exposure and metric results for experiments enabled in lower environments. Helping users catch issues early and ship experiments with confidence.
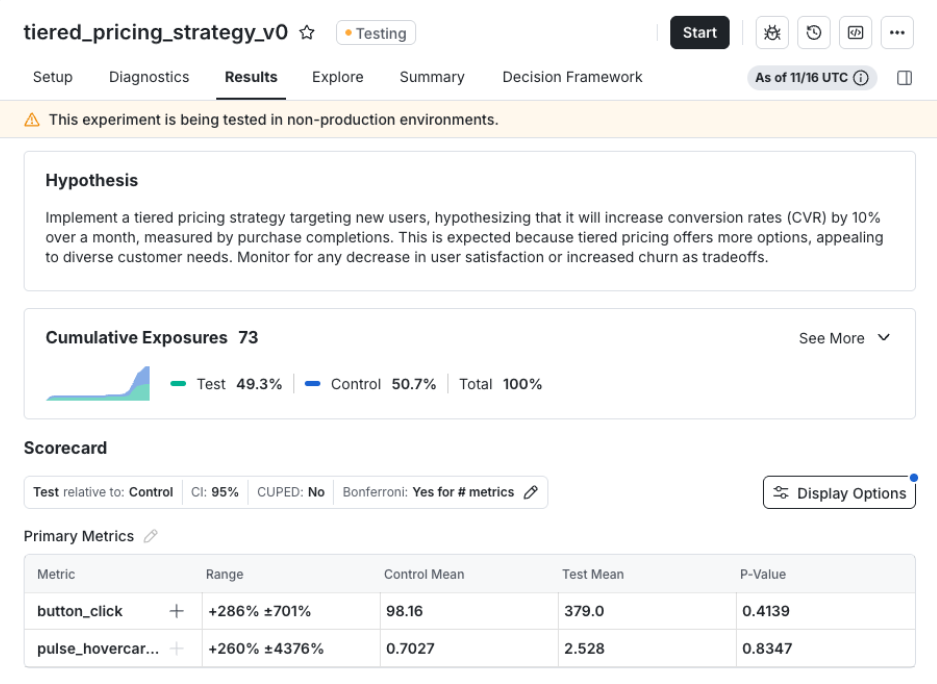
This makes it easier to verify that:
Users are being bucketed correctly
Your metrics are logging as expected
To enable this, go to the experiment setup page, select Enable for Environments, run tests in your lower environment, and view real exposure and metric data before launching to production.
For more information on the new lower environment testing features see the docs here.