Products
Solutions
Resources
Product Updates

🚨 Topline Alerts on Metrics
Topline Alerts work best when they track the exact metric your team relies on. Until now, Topline Alerts could only be created using events, which meant rebuilding the metric logic each time. This increases the potential of duplicated definitions, drift over time, and confusion about what the “real” definition should be defined as.
This update fixes that. You can now create Topline Alerts using existing metrics in your Metrics Catalog. The alert uses the metric’s definition exactly as it is, so everything stays consistent and aligned. No rewriting. No re-creating logic. No guessing which version is correct.
It keeps your metrics clean, keeps ownership clear, and removes the risk of definitions drifting as teams grow.
🍋 Metric Source Freshness
Statsig WHN users can now quickly check the freshness of their Experiment Metrics Source data directly from the experiment results page. The data displays the most recent timestamp found in a Metric Source during results computation, helping users identify potential issues in their data pipeline that could delay results calculation.

🧏♀️ Recent Queries in Logs Explorer
Debugging usually means retracing your steps. You try something, flip tabs, run a new search, and then can’t remember the exact query that actually pointed you in the right direction. It breaks your flow and slows everything down.
Recent Queries fixes that. Logs Explorer now shows your last five searches right in the search menu. No more digging through tabs or guessing what you ran before. Jump back into earlier investigation paths, compare results in seconds, and pick up your workflow without losing momentum.
A small change with a big payoff for staying in the zone.
🏡 Metric Family
Managing a large metric catalog can be challenging—especially when many metrics are slight variants of a single source metric. Ensuring that updates to the main metric cascade correctly to all of its variants can be difficult and error-prone.
For our WHN customers, we’re excited to introduce Metric Families. Users can now create Child Metrics (variants) from a Parent Metric, ensuring that any changes to the Parent automatically flow down to its Children. This makes it easier to manage large catalogs while giving teams the flexibility to create and maintain metric variants without losing consistency.
The feature is available for Sum and Count metric types. Follow this link to learn more.

🧾 Experiment Results Table View
Today we're excited to announce Table View for experiment results. It's perfect for users who want to examine their experiment results in greater detail while keeping everything consolidated in a single view.
With Table View, users can now see Control Mean, Test Mean, and P-value—in addition to the data points available in the default cumulative view.

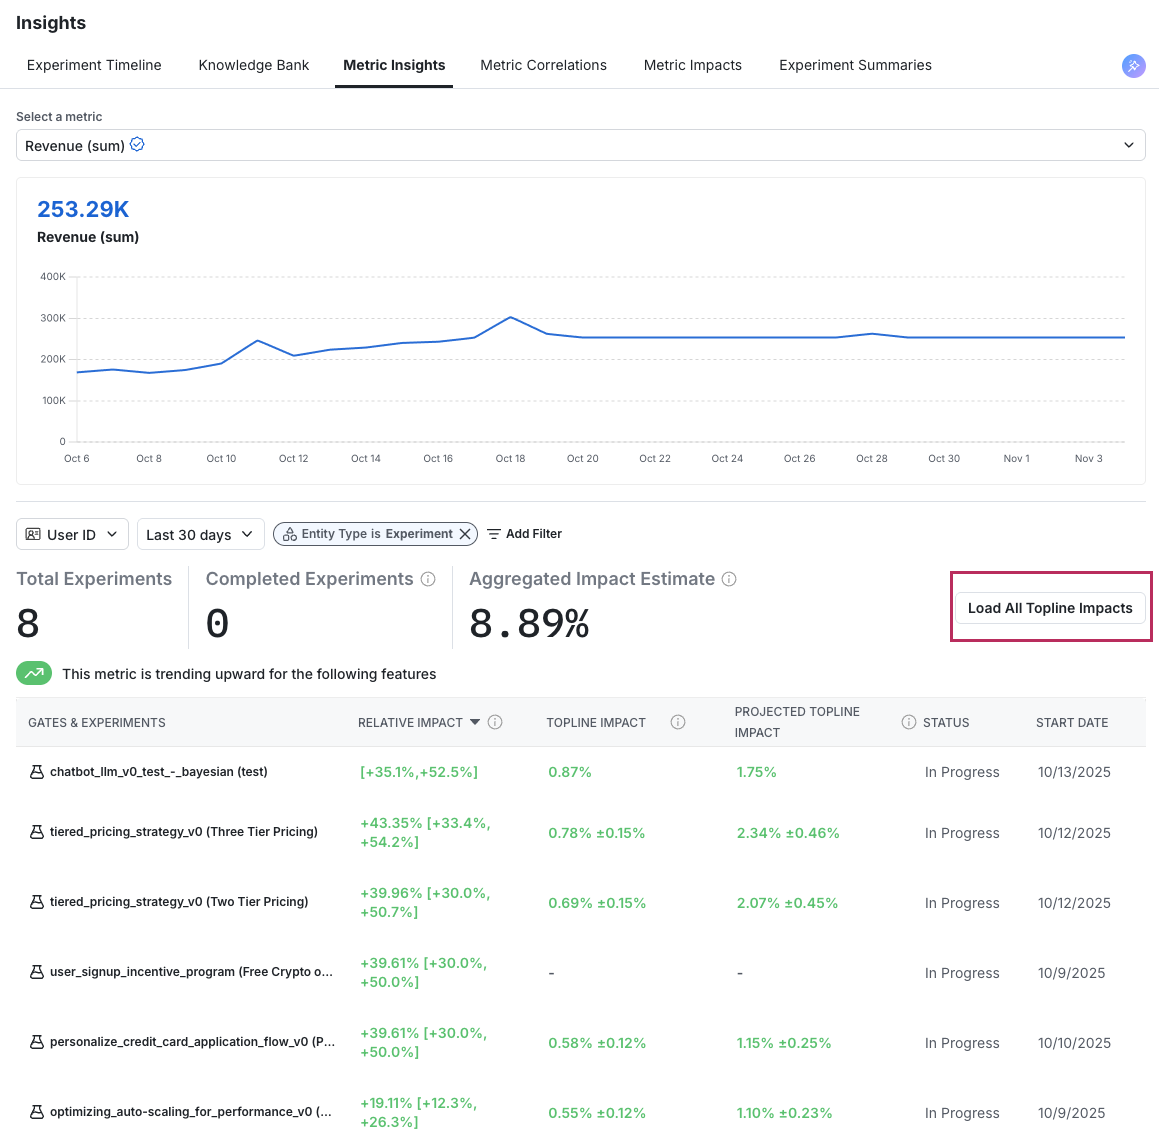
📚 Bulk Topline Impact Calculation
Many users want to understand how the metric changes measured in their experiment translate to shifts in the overall metric (topline impact) or project the expected impact if the variant were rolled out to the broader population (projected topline impact).
For our WHN customers, calculating Topline impact just got easier with the launch of our bulk upload feature. Users can now update this data centrally from the Experiment Insights Page, making it easier than ever to measure the aggregate impact of experiments on key business metrics.
🧅 Layers UI Improvements
Layers is a powerful Statsig tool that lets you configure mutual exclusivity and manage parameters across experiments and holdouts—all while simplifying your code. (learn more here).
With the new UI improvements, managing your mutually exclusive experiments and holdouts just got even easier. You can now see at a glance which experiments and holdouts map to the different parameters configured on the layer.

🪵 Console Logs in Session Replay + Activity Pane Revamp
Session Replay now includes a Console Logs view, detailed inspectors for any logged event, and a new Overview section.
What You Can Do Now
View browser console logs captured during a replay, including info, warnings, and errors.
Inspect any individual console log to see full details for that entry.
Inspect any logged event from the Activity pane to see a detailed breakdown of that event instance.
Use the new Overview section to see key user and session metadata for the recording.
How It Works
Console Logs. Setup console logs capture as part of Auto-capture through that Statsig SDK. Once that is set up, you can open a replay, expand the Activity pane, and select Console Logs. Click the inspection icon next to a specific log to view its details.
Event Details. In the Activity pane, click on "Events" and then click the inspection icon next to any event to see its properties and context for that exact instance.
Overview. Open the Overview section in the Activity pane to see recording-level details about the user and associated session metadata.
Impact on Your Analysis
Faster debugging with console context aligned to moments in the replay.
Clear visibility into what the browser reported at the same time a user took an action.
Quicker triage by drilling into the exact event or log entry without leaving the replay.
Available Today
Open any session replay to try Console Logs, the event inspectors, and the new Overview section in the Activity pane.
🧮 Sum Property Values at Funnel Conversion
You can now sum a numeric event property for the final step of a funnel to quantify value generated by conversions.
What You Can Do Now
Attribute revenue to a funnel by summing a property like order_value on the conversion step.
Measure other totals such as items_count, credits_used, or time_spent for converted units.
View the total directly in the funnel table as a new column on the final step.
How It Works
In your funnel’s Advanced settings, select Sum property value for last step.
Choose the numeric property from the conversion event to sum.
The funnel table adds a column on the final step showing the total for units that converted.
The sum reflects the same cohort and filters used by the funnel.
For totals across all conversion events, turn Unique Users off. With Unique Users on, each user contributes at most one conversion to the sum.
Impact on Your Analysis
Connect conversion to value by quantifying totals like revenue for the users who completed the funnel.
Compare totals across segments using your existing breakdowns to see where value concentrates.
Track changes to total value when you adjust steps, filters, or time ranges.
Available today on cloud. Coming next month for Warehouse Native.
💪 Power Analysis Enhancements
We’ve rolled out several updates to make Statsig’s Power Analysis Calculator more powerful and easier to use when planning experiments.
You can now:
Review multiple metrics side-by-side to see how power and duration vary across key metrics in one view.
Set a target MDE across your metrics to clearly see the optimal experiment duration across your metrics.
Share results with saved configurations, so your team sees the same inputs and assumptions when reviewing analysis.
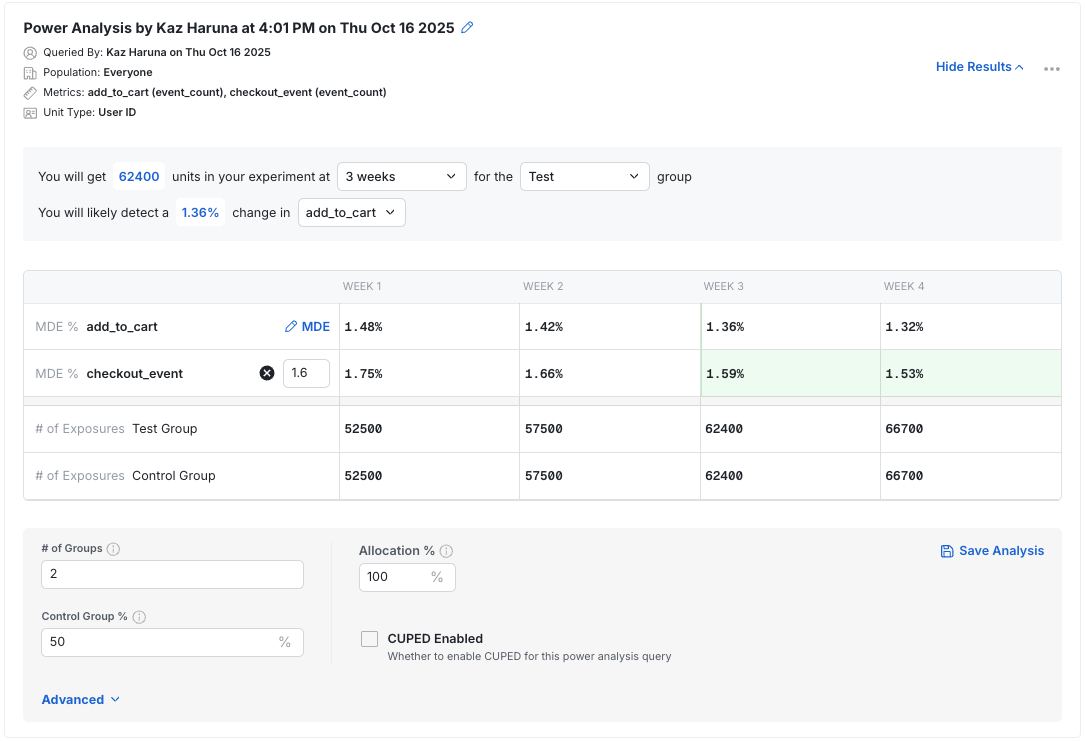
For Statsig Cloud users, Power Analysis now supports multiple qualifying events and event parameter filters, allowing more precise reflection of your experiment setup and traffic definitions.
With these updates, users can plan well-powered experiments and better align on timelines with your team.