Products
Solutions
Resources


Measuring the impact of new features has always been important. Now, with the addition of AI, it’s more critical than ever.
Engineers and product teams need to understand how their work influences user behavior, business metrics, and overall product performance.
Statsig is designed to streamline this exact process, and offers a suite of tools that enable teams to launch features confidently, measure their impact, and make data-driven decisions.
And while we highly recommend using Statsig as a unified platform, all of the subsequent concepts can be implemented with several different tools and tactics.
Here’s how to make it happen with Statsig.
Prerequisites
Before diving into feature impact measurement, ensure you have:
An active Statsig account
Integrated Statsig SDKs into your application
A clear understanding of the key metrics you wish to track
Measuring feature impact: Step by step
While much of this is typically standard practice at large tech companies with their own in-house feature flagging and analysis tools, Statsig makes it easier to focus on what’s important.
For smaller companies, startups, and even hobbyist builders, launching and measuring the impact of features with Statsig gives you a profound advantage. The insights you gain might even re-shape your roadmap.
Step 1: Define your metrics
Start by identifying the key performance indicators (KPIs) that align with your company goals. These could include user engagement, conversion rates, or revenue metrics. In the context of AI, you might track model performance, latency, or cost metrics. Statsig allows you to use pre-built metrics or create custom ones tailored to your needs.
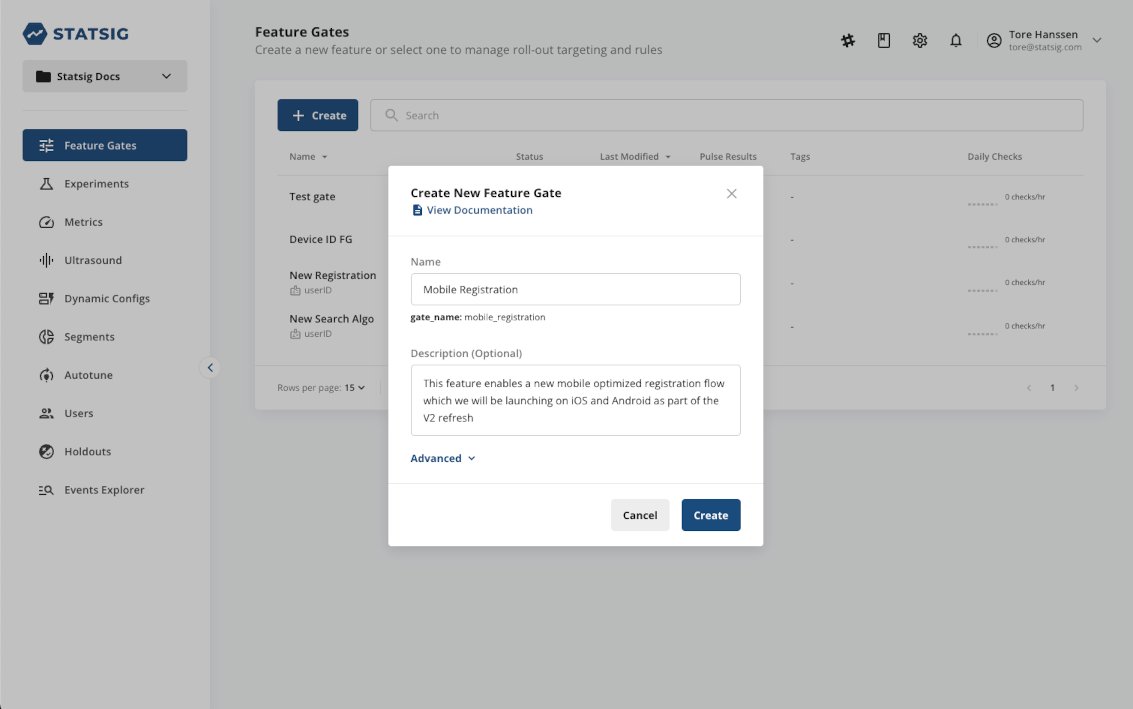
Step 2: Set up feature flags
Feature flags, also known as feature gatess, are a powerful way to control the rollout of new features. They allow you to enable or disable features without deploying new code. In Statsig, setting up a feature gate is straightforward:
Navigate to the Feature Gates section in the Statsig console.
Create a new gate and define your targeting rules.
Implement the gate in your codebase using the Statsig SDK.
For AI features, you might have gates that control different model versions or AI-driven user interfaces.
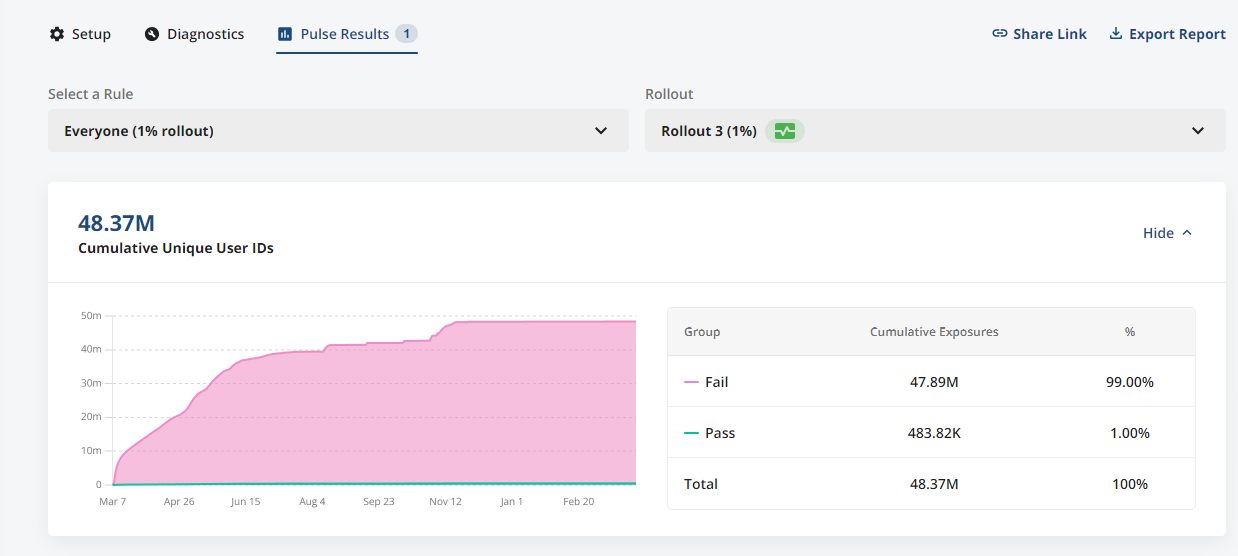
Step 3: Launch and monitor rollouts
With your feature gates in place, you can begin a controlled rollout. Start with a small percentage of your user base to monitor the feature's impact. Statsig automatically converts feature rollouts into A/B tests, allowing you to compare the performance of users with the feature (test group) against those without it (control group).
Step 4: Analyze impact with Pulse and Insights
Statsig provides two powerful tools for analyzing feature impact:
Pulse: Gives you a high-level view of how a new feature affects all your metrics.
Insights: Focuses on a single metric and identifies which features or experiments impact it the most.
Use these tools to assess the impact of your AI features on user behavior and business outcomes.
Step 5: Experiment with Autotune
Autotune is a Statsig feature that automatically optimizes for a single metric by testing multiple variants. This is particularly useful for AI features where you might want to test different model parameters or configurations.
Related reading: How to optimize model temperature with Statsig’s Autotune.
Step 6: Review and iterate
After analyzing the results, decide whether to roll out the feature to all users, iterate on it, or roll it back. Statsig's dashboard provides detailed metrics, including statistical significance, to inform your decision.
Examples of measuring feature impact
The following examples are commonly measured types of impact regardless of product or industry:
User engagement: If you've introduced an AI chatbot, measure engagement by tracking the number of interactions per session before and after the feature rollout.
Conversion rate: For an AI recommendation system, compare the conversion rate of users who received personalized recommendations against those who didn't.
Model performance: When rolling out a new AI model, use feature gates to compare the performance, cost, and latency against the previous version.
Debugging and troubleshooting
If you encounter issues during your feature rollout, Statsig offers tools to help you debug:
Metrics Dashboard: Troubleshoot ingestion issues and verify that events are logged correctly.
Events Explorer: View a sample of events contributing to a metric to ensure accurate tracking.
Empowering data-driven decisions
By following this guide, you've learned how to measure the impact of features effectively using Statsig. The platform's experimentation and feature management capabilities enable you to launch features with confidence and make informed decisions based on real data.
For further exploration, consider diving into advanced experimentation techniques, reading our documentation, or joining the Statsig community to share insights with peers.
Remember, the key to successful feature impact measurement is continuous learning and iteration. Keep refining your approach, and you'll unlock the full potential of your features in the AI-driven landscape.
Get started now!

Related reading
Explore advanced experimentation strategies with Statsig's Experimentation Program Guide.
Learn about integrating Statsig with other tools in the Integrations Documentation.
Join the Statsig Slack community for support and to connect with other users.
Happy experimenting!
Join the Slack community