Products
Solutions
Resources


What happens when you cut your B2B Facebook Ads spend down to zero?
What happens when you slash 40% of your outgoing emails, or remove educational videos from your academy’s landing page? The results of experimentation are anything but intuitive.
While data will tell most of the story, it can sometimes fall short. Even if your reporting is laser-accurate, metrics are intended to be proxies that roll up to business impact, and sometimes they need to be tested, too.
Even hypotheses that intuitively make perfect sense, like "This educational video belongs on the landing page of our academy," don't always hold up under experimental scrutiny. Much like the Play-Doh story, the way users ultimately interact with products, apps, and websites, isn't always aligned with our expectations.
In true experimentation fashion, let’s set our hunches and hypotheses aside and analyze some counter-intuitive B2B experimentation takeaways.
Michael Carroll’s (Posthuman) ads shutoff experiment
“I cut monthly Facebook ads spend from $20,000 to zero and nothing tragic happened.”
Metrics tracked:
Ad spend by channel
New sales
New sales revenue
Michael Carroll is the VP of Growth at Posthuman, a creative agency that specializes in finding winning growth strategies and scaling them. Experimentation is one of his major strategic components.
I recently had the pleasure of interviewing him about one of his favorite (or least favorite) experiments, which involved assessing Facebook Ads for a client, and eventually deciding to shut it down—despite apparent evidence that it was performing well.
The question he wanted to answer: “Is paid acquisition actually driving growth?”
Unclear attribution
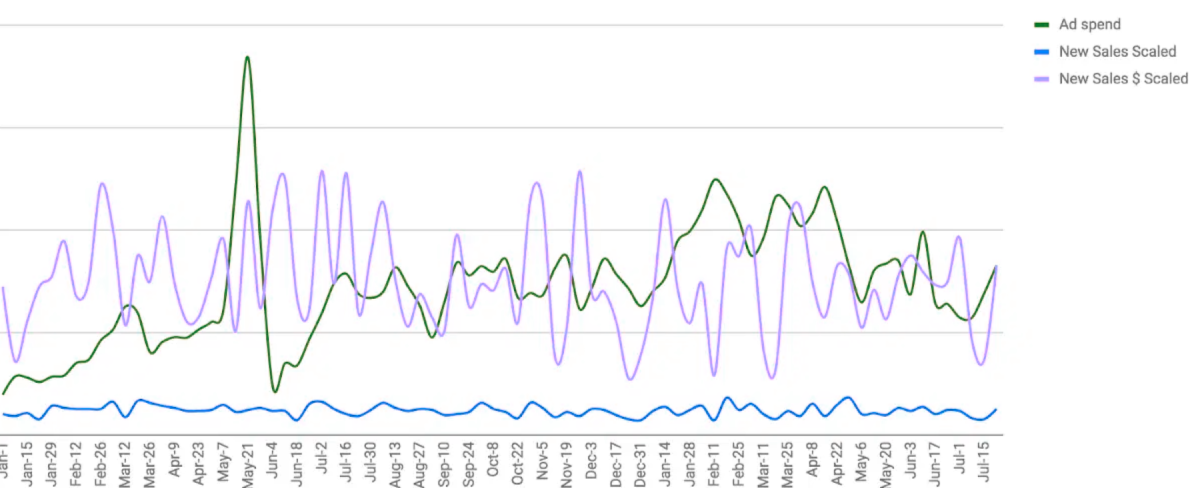
“As you can see, even without the trend lines, there’s no apparent rhyme or reason to the overall effect of paid acquisition,” he says.
“I don’t believe there should be a one-to-one ratio between spend and number of new sales or new MRR, but a basic correlation should be apparent. With no correlation between overall spend and sales growth, the next logical question is ‘Is the correlation being disrupted by a particular channel?’”
After breaking out and visualizing paid spend versus paid acquisition across all channels, it became clear that other ads platforms, like Adwords, were doing well. When it came to Facebook, Michael couldn’t be so sure.
“’Facebook works, our attribution data is flawed,’ is the position the company held. Truth be told, I had my own doubts about the accuracy of the attribution data. Overall sales, traffic, and leads from both organic and direct traffic sources, were all strong while Facebook campaigns were running.”
Additionally, Facebook ads were filling their re-marketing coffers with cheaper yet highly valuable traffic. As Facebook advertising spend increased, conversions from re-marketing campaigns increased in lock-step. “Since we were using isolated landing pages, there was no doubt that Facebook was driving this growth.”
Forming a hypothesis
As is often the case with data, things got weirder the deeper Michael dove. “When I examined the traffic driven to the website by Facebook, the tracking pixel over-reported website visitors by 25-35% versus traffic in Google Analytics.”
“To me, the preponderance of evidence pointed in one direction: Facebook leads were not meeting our standard of quality and as a result, weren’t translating into sales.”
With that, Michael suspended all Facebook advertising of any kind.
And waited…
The results
"Nothing tragic happened."
While some numbers, like organic traffic, took a slight and temporary dip (9%), none of the aforementioned hypotheses about Facebook ads driving sales seemed to hold up.
Additionally, there wasn’t any correlation between Facebook advertising spend and organic leads, traffic, or any of the others that seemed correlated before.
“In the 60-day aftermath of my experiment, the shutdown of Facebook advertising had absolutely no negative effect on sales—which is significant because the average trial-to-customer conversion time was only about 12 days.”
Takeaways
Michael offers a bit of advice for those looking to perform experimentation at their own B2B companies:
“Trust your gut, but trust the tests. Sometimes, like in our case, all the reports you can muster still don’t paint a clear picture. When this happens, just test it.”
He adds one additional, crucial word of advice. “When performing your own experiments, keep your tests clean by isolating your variables. Now matter how well-defined you think your experiment is, there are always going to be variables muddying the results.”
📖 Related reading: Picking metrics 101.
HubSpot Academy homepage test

If you’re a HubSpot user, you’ve been to HubSpot Academy plenty of times.
HubSpot embarked on an A/B/n test to improve the experience of its HubSpot Academy landing page and increase the number of users signing up for its courses.
Metrics tracked:
Primary: Conversion rate
Secondary: CTA clicks, engagement
The team at HubSpot noticed that the conversion rate for the informational video on the academy’s landing page wasn’t getting the engagement it deserved: Only 0.9% of users were watching the video.
The video itself was in place to reinforce the importance of HubSpot Academy in order to get more users signing up, and going on to become HubSpot-certified power users. While the initial hypothesis was developed in regard to the video engagement, their overall experiment was designed to increase the conversion rate.
The experiment
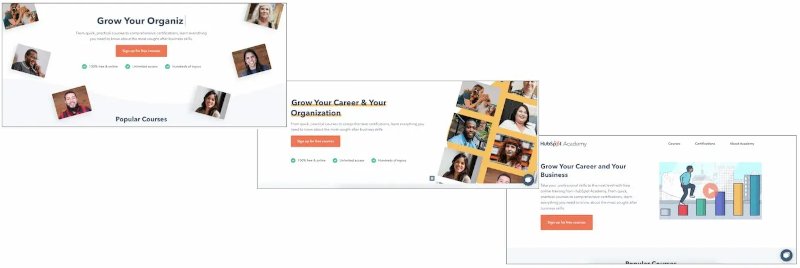
HubSpot employed an A/B/n test to test three variants of the HubSpot Academy landing page.
Variant A remained the control, and variants B and C incorporated various animations and graphics on different parts of the landing page.
The results
With conversion rate as the primary metrics to increase, and secondary metrics of clicks and various other engagement metrics, HubSpot detected a clear winner, and shipped that version, yielding a 6% increase in signups.
A similar design is still used today on the HubSpot Academy landing page.
LinkedIn’s notification experiment

Metrics tracked:
Email sends and clicks
Downstream pageviews and sessions
Unsubscribes
LinkedIn has its own internal A/B testing platform called XLNT, which it uses to experiment with many different aspects of the LinkedIn experience. For this example, we’ll zoom in on its notification strategy.
For LinkedIn, there are two primary offline channels used to communicate with members: Email messages and push notifications. All other communications occur within the app or website.
Typical offline communications for LinkedIn included member-to-member invitations, email digests, job recommendations, and dozens more.
Offline communications are particularly useful for LinkedIn, as they provide the ability to reach members without requiring them to be actively logged-in to LinkedIn via app or website.
The problem
While offline communications provide value to LinkedIn members, they run the risk of hurting user experience by inundating users with too much communication.
The hypothesis: “LinkedIn sends too many emails and notifications.”
Methodology
New features at LinkedIn first roll out to LinkedIn employees, then a small, randomized sample of users, and then are shipped globally if they uplift the target metrics without negative consequences.
In this case, LinkedIn made changes to the way they deliver offline communications for the purpose of increasing user interactions and overall quality of life.
The results
In this case, LinkedIn’s experiment was able to confirm its hypothesis as true, as they effectively halved the complaints from members about receiving too many emails. In addition, LinkedIn saw increased engagement for its remaining offline communications.
Through experimentation, they also uncovered additional insights about two conflicting experiments that were both impacting email deliveries for a given segment.
In the end, LinkedIn decided to cut 40% of its offline communications. If you’ve noticed an increased quality in your communications from LinkedIn, you have experimentation to thank.
Sidecar no-code A/B testing
Bonus: Nomad Health’s easy win

“The results surprised no one.”
Metrics tracked:
Conversions
Engagement metrics
Google ads score
I recently interviewed Rebekka Kuhn, former Art Director at Nomad Health, about her Google Ads experiment—the results of which were 100% congruent with the hypothesis.
Nomad Health is a platform that connects travel clinicians with open jobs all over the country, simultaneously providing employment opportunities (B2C) and filling staffing needs for healthcare facilities (B2B).
The problem
The first version of Nomad Health’s Google advertisements drew all job seekers to the same landing page, whose value props were targeted at travel nurses:
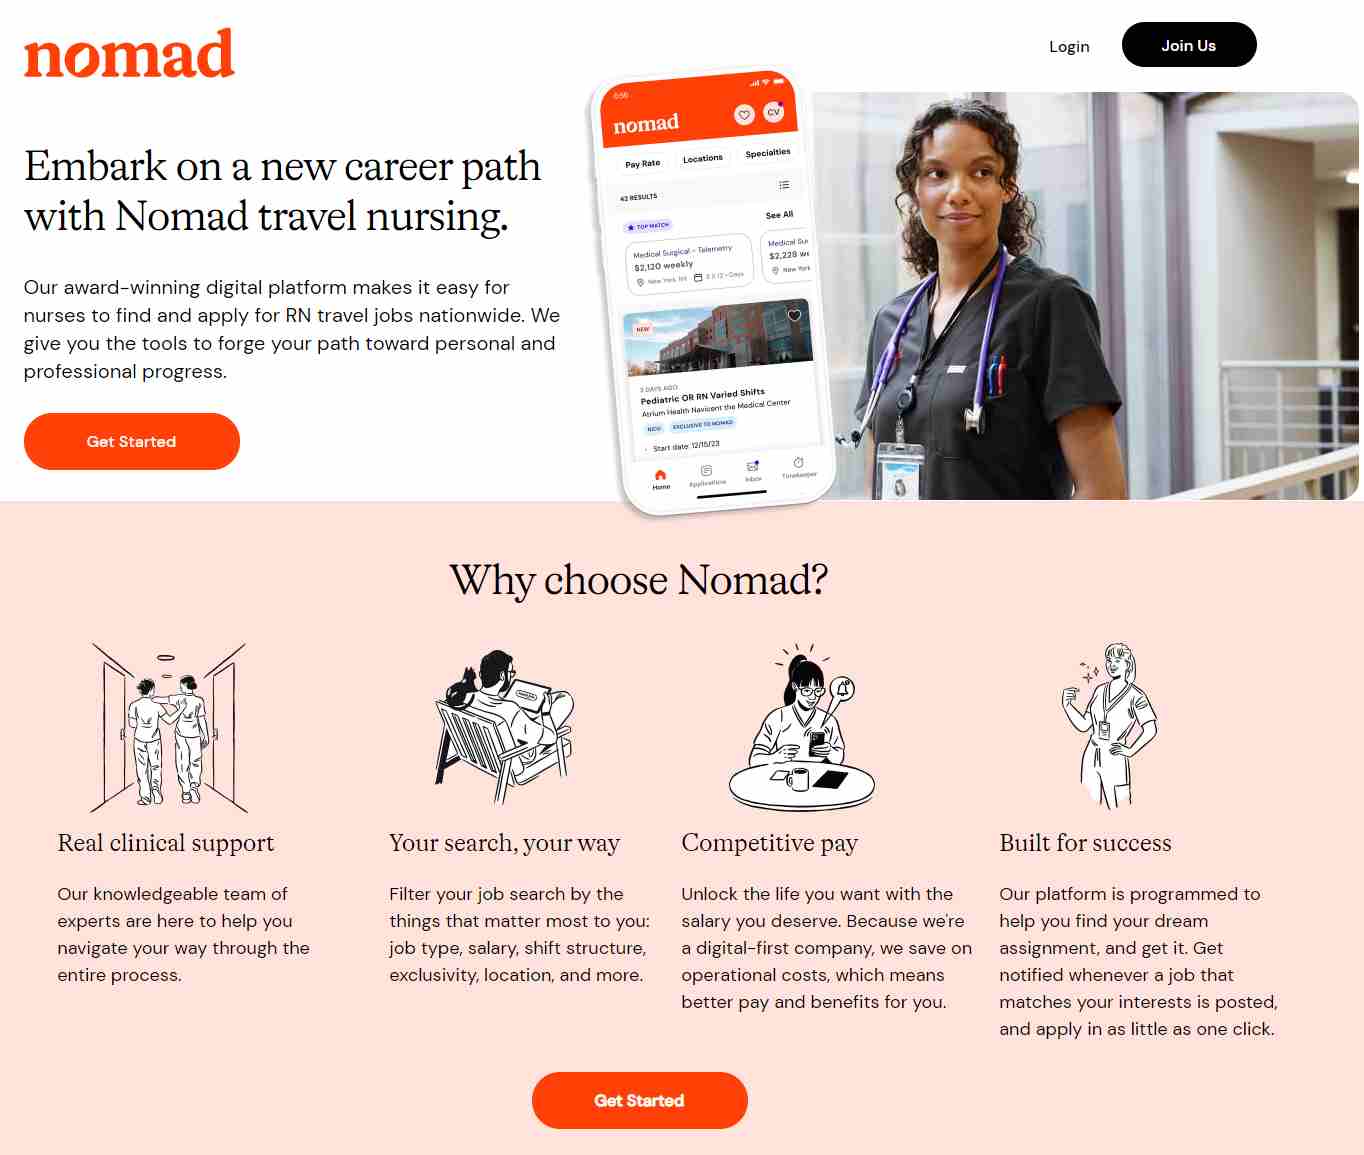
“Nomad Health places travel nurses as well as allied health professionals like radiology technicians, ultrasound technicians, surgical technicians, and so on.”
The marketing team hypothesized that ads hyper-targeted toward their persona would increase conversions. This meant not just page copy but verbiage, photography, product screenshots, and the copy used in the Google Ads themselves.
The results
“The results surprised no one. By matching ad copy and landing page experience with personas, we saw an increase in conversions and an improved ad score.”
Nomad Health initially tested the hypothesis with surgical technicians. Sure enough, conversions increased instantly.
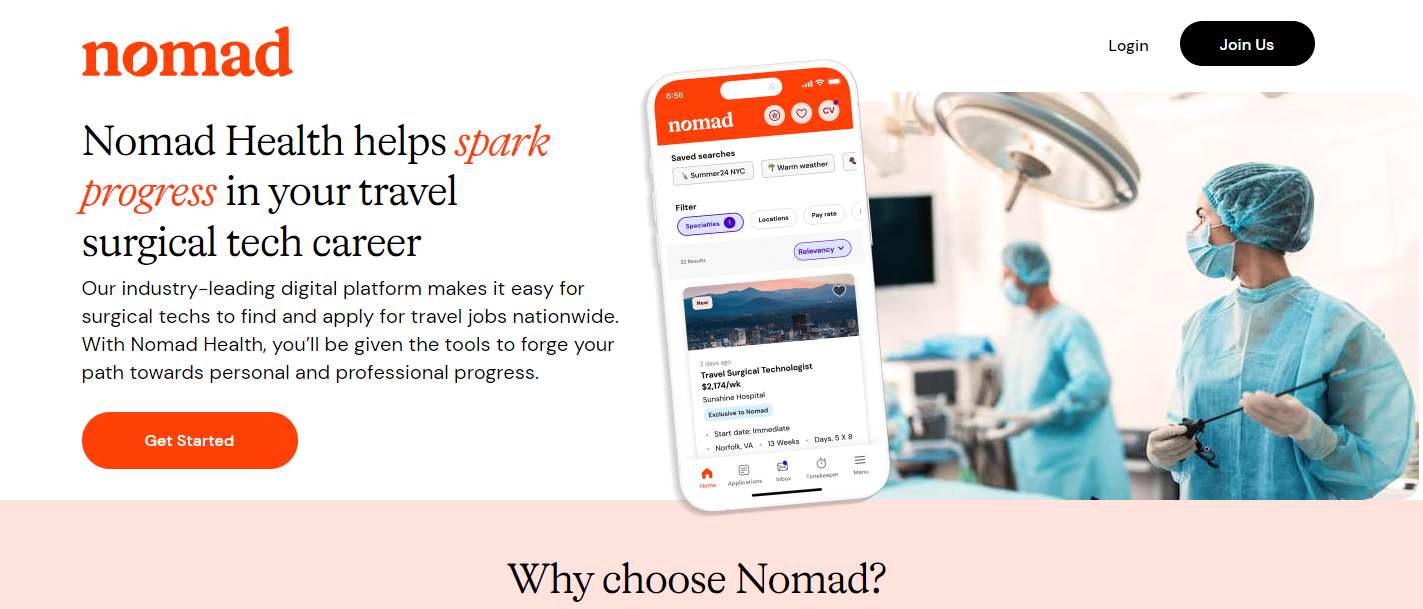
“After seeing the results we got from experimenting with our surgical technician ads, we rolled out the same treatment to all of our personas.”
When in doubt, test it
In the end, the path to innovation is not a straight line—it’s a series of experiments, each informed by the one before.
The examples we’ve explored, from Posthuman’s audacious ad shutdown to LinkedIn’s email revamp and beyond, exemplify just how transformative a culture of testing can be.
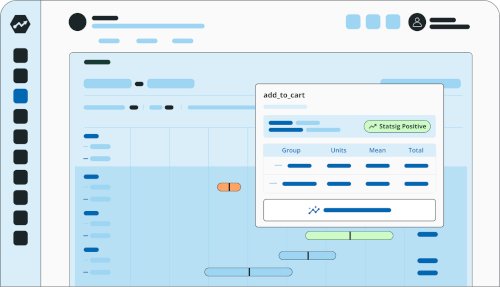
If you're ready to start your own B2B experiments, create a free Statsig account today. ⬇️
Get started now!

✨ Related reading: