Products
Solutions
Resources


After being unsatisfied with various online Sample Size calculators, we decided to build our own.
Unlike other calculators, ours can handle different group proportions (e.g. 20/80 ratios) and we’re excited to share our methodology in this blog post.
We hope that sharing our calculations also solves two broader problems:
Transparency: Online calculators give different answers and do not explain why. This makes them hard to evaluate. As a data scientist, I couldn’t stake my reputation on any of these.
Education: I struggled to find a solid explanation for how to calculate sample sizes from first principles. To me, most online resources failed to explain which cases they cover and how to use their formulas (eg. does σ mean standard error or standard deviation? Is this for the test or control, or is this pooled?). They also only considered proportion metrics (eg. click-through rates) which ignores a lot of other important metrics (eg. time-spent and payment amount).
For me, the final straw was not finding any solution to calculating sample sizes for imbalanced tests (eg. 20% test and 80% control) which are becoming the norm. Deriving these equations was fun and I’m happy to share them here.

Why Calculating Sample Sizes is Critical
Calculating the required sample size for an A/B Test (also known as a split test or bucket test) helps you run a properly powered experiment. Just like you would check your gas tank before a road trip, you want to check your sample sizes before launching an experiment. Too few samples (users) and you won’t likely see the effect. Too many samples and you risk exposing a bad test to too many users for too long while slowing your team’s pace.
Setting Your Test Up for Success
As A/B testing is subject to randomness, we need to limit two types of errors:
1. Type I errors are the chance that given no experimental effect we will still detect a statistical difference through randomness. This is referred to as significance level (⍺) and is commonly set to 0.05 (or a 5% chance).
2. Type II errors are the chance (β) that a real effect (MDE) won’t show significant results. Power (1-β) is the chance that a real effect will produce significant results. We commonly set to power to 0.8 (80%) and β=0.2.
Minimum Detectable Effect (MDE)
MDE is the smallest effect you want to observe in an experiment. While any positive effect is good news, smaller effects are harder to measure and require more samples and time. Lengthy and large tests with small effects are generally not worth running. Knowing this helps you set a reasonable MDE and determine whether an experiment is worthwhile.
Calculating Sample Sizes
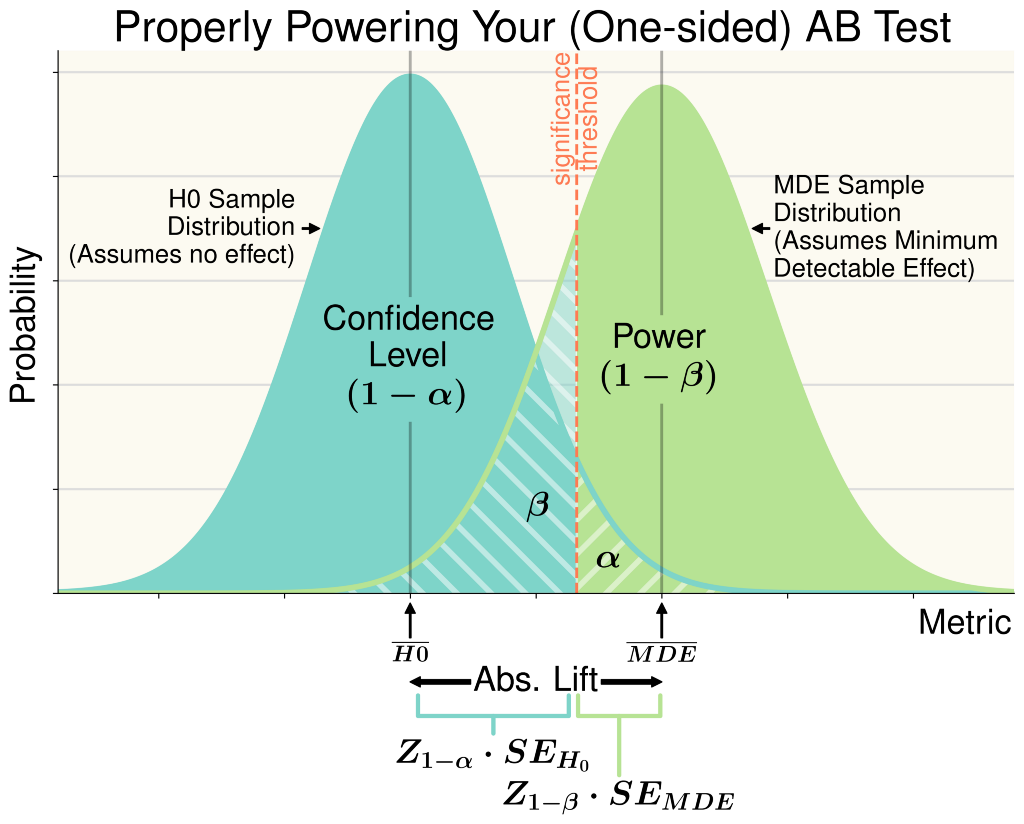
This is the standard framework for understanding the distribution of outcomes in an A/B test and calculating sample sizes. The above leads to the following formula:

Where:
H0 is the mean result we expect the control and test groups to produce if there’s no experimental effect.
MDE is the minimum detectable effect, or what we expect (at a minimum) the test group to show.
Z(1-⍺) is the number of standard errors from H0 (assuming no effect) that we set the significance level to. I prefer one-sided tests as they give actionable results, but if you are running a two-sided test, you want to use Z(1-⍺/2) instead.
Z(1-β) is the number of standard errors from MDE (given an effect). This is our safety buffer to minimize Type II errors.
SE(H0) is the standard error of the difference between test and control in the situation that there is no difference.
SE(MDE) is the standard error of the difference between test and control when the test group has the minimum detectable effect.
Solving this requires solving two different standard errors, SE(H0) and SE(MDE). Each standard error reflects the distribution of a comparison (between A and B). Whenever we compare two groups, the resulting variance is the sum of each group’s variance. SE(H0) is the standard error of the null hypothesis, H0 (no effect). Since there’s no effect, both group A and B have the same standard deviation, σ₀.

SE(MDE) is the standard error of the minimum detectable effect. The MDE (test group) likely has a different standard deviation, but it’s mathematically convenient to assume they are the same. This simplification is fairly accurate for small test effects which is when measuring sample sizes is the most critical (large effects require less samples and don’t generally have power concerns). In the end, this leads to SE(H0) = SE(MDE).

I’ll save you the tedious algebra, but further simplification produces:

We have an estimate for every term here except that radical expression with nA and nB. Solving this would produce a relationship between nA and nB. What’s more useful is specifying a split ratio (r). For the canonical 50/50 test, r = 0.5. But it’s common for product teams to ship a feature to 10% of users in cases where you want to be cautious (r=0.1), or a 90/10 test if you want to broadly ship a feature, but still want to measure its effect (r=0.9). We can replace nA and nB with ratio (r) and total samples (nTotal = nA + nB) as follows:

Solving for nTotal produces our final answer:

This formula has many advantages over what you may find elsewhere:
You can calculate A/B tests with unequal test vs control groups. Most online calculators assume you want to run a 50/50 test which is becoming less common.
You can provide your own standard deviation. Most online calculators assume you have a proportion metric (like click-through rate or payer ratios) because it’s common but also makes the calculation easier. The above formula will work for non-Bernoulli metrics like timespent or average payment amount.
If you have a proportion metric, go ahead and use:

Otherwise, you can estimate standard deviation from your current data.
Let me know if you’ve found this useful or have any questions about experimentation. May all your tests be properly powered.
Related reading: A/B testing 101
🤖👉 Try now: Create your first A/B/n test.