Products
Solutions
Resources


You’re done arguing about website copy. It’s time to bring out the data.
A/B testing is a powerful tool for optimizing website performance and improving user engagement. By comparing two versions of a webpage, marketers and web developers can determine which elements resonate best with their audience and drive desired actions.
Whether it's tweaking a call-to-action button, refining content, or testing new features, A/B testing provides data-driven insights that can significantly impact conversion rates and overall marketing strategy.
In web design, almost everything should be tested comprehensively. The main disconnect that web copywriters face is the gap in perceptions around how a company represents itself versus how users perceive it.
Testing can help you speak to your users in a way that resonates, and ultimately guide them through your site content in a way that makes sense to them.
This is where the data comes in.
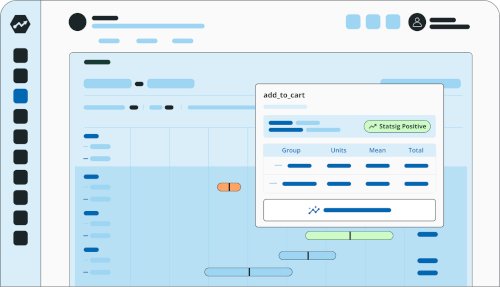
Sidecar no-code A/B testing
Top 8 A/B tests for website optimization
1. Headline variations:
The headline is often the first thing visitors see. Naturally, you’ll want to get it right.
For home pages, your headline is meant to captivate attention and encourage the users to scroll and read more, while simultaneously conveying your value props. It’s not easy to get it right on the first try.
2. Call-to-action (CTA) buttons
As a general rule, you should always be experimenting with the color, size, placement, and wording of your CTA buttons to find out which combination leads to higher click-through rates.
Website buttons have been the subject of experiments since day one, with many good articles on the subject explaining how and why to do it.
The TLDR? Words, shapes, and colors convey different meanings and emotions. Since there’s no one-size-fits-all solution to what a button’s color and text should be, it’s your responsibility to find the best fit for your web pages.
Read more: How we optimized our own button colors.
3. Landing page layouts
If you use a CMS, or have a site that allows you to order content by strips, you may have tried this A/B test already.
A/B testing landing page layouts is usually centered around which order to introduce information to users viewing the page. Should the button be in the center, above the fold, or should it exist after the content, so that users have time to read and understand what they’re clicking?
4. Navigation menus
Simplify your navigation menu or try different menu structures to improve the ease of site navigation and access to information.
Some sites have simplified menus that take you to listing pages that list all the resources below a given menu. Other sites have a hover or click state that unfolds all the options in a “tray” UI element.
They each have their trade-offs. Think about how many clicks you want your users to have to take to find your impactful content, and then determine whether that content belongs in a tray or its own clickable nav element.
5. Form fields
Should your forms display in full, so that users can see the entirety of the form before committing to filling it out, or should they be paginated?
This was one of the revolutionary changes that happened to online forms during the 2008 presidential election. Ultimately, it was deemed that paginating forms were actually more attractive to users due to sunk cost fallacy: Once a user had already begun filling out a seemingly short form, they were less inclined to abandon it upon discovering that there’s more content on the second page.
6. Images and videos
They say a picture is worth a thousand words. Make sure those words aren’t “no thanks” 500 times.
Testing images and videos on your site—especially your homepage—is a great way to ensure your users are sticking around. A video on the homepage might sound like a good idea, but if it doesn’t increase users’ time on page or clicks, it might just be bloating your page load.
Further, what images work best for conversions? Do users want to see product screenshots upfront, or should you use design-led impressions of your product and allow users to discover more as they click through?
There’s no way to know without testing.
7. Content length and formatting
The length of your page can play a surprising role in how long users stick around.
Sometimes it’s best to keep your content punchy and concise, like on a landing page, detail page, or conversion page (like “request a demo.”)
Other times it makes sense to give as much detail upfront, like explaining the “how” and “why” so that your users can make informed decisions about how to interact with your site.

Again, don’t leave this up to your gut feelings. Test it!
8. Pricing structures
How much information should you display on your pricing page?
If you pricing page includes comparisons against competitors, should you include all of them, or just a handful?
Conducting pricing A/B tests are a great way to discover which information is pertinent for potential customers versus information you personally think is relevant.
What metrics should I track?
When A/B testing your website, you’ll need to be tracking a handful of metrics for each experiment in order to determine which testing variants are successful.
Fortunately, Statsig provides lots of out-of-the-box metrics so that you can get started testing right away without spending much time creating and configuring custom metrics to track.
Some website A/B testing metrics include:
Conversion rate
The conversion rate is the bread and butter of A/B testing metrics. It measures the percentage of users who take a desired action on your web page. This could be anything from making a purchase, signing up for a newsletter, downloading a whitepaper, or any other goal your site aims to achieve.
Click-through rate (CTR)
CTR is a key metric for understanding how compelling your content or call-to-action (CTA) is. It measures the number of clicks on a link or button divided by the number of times the element was viewed (impressions).
Bounce rate
The bounce rate tells you the percentage of visitors who navigate away from your site after viewing only one page. A high bounce rate could indicate that your landing page isn't relevant to your audience or isn't engaging enough to keep visitors exploring your site.
Time on page
This metric measures the average amount of time visitors spend on your A/B test pages. It can give you insights into how engaging your content is. If there's a significant difference in time spent between Version A and Version B, you might have found a winning formula.
Pageviews
Tracking pageviews can help you understand the overall traffic patterns on your A/B test pages. It's a straightforward metric that counts the total number of times a page was viewed.
Revenue per visitor
If your site's goal is to generate sales, revenue per visitor is a crucial metric. It measures the average amount of money generated from each visitor to your A/B test pages.
User behavior metrics
These metrics include actions like scrolling depth, mouse movements, and interaction with specific elements. Tools like heatmaps can provide visual representations of where users click, move, and scroll on your web page.
Segmented user data
Segmentation involves breaking down your visitors into groups based on demographics, behavior, or source of traffic. This can help you understand how different types of users interact with your web page.
Net promoter score (NPS)
NPS measures customer experience and predicts business growth. You can use this metric to gauge the loyalty of your website's user base by asking how likely they are to recommend your web page to others.
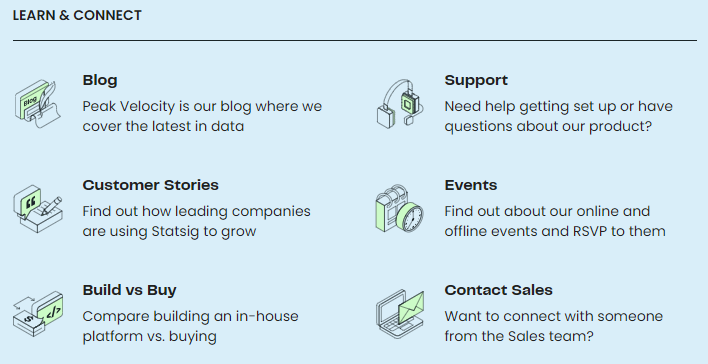
Join the Slack community

How to implement website A/B tests
Prerequisites:
A clear understanding of your website's current performance metrics.
Access to an A/B testing tool like Statsig, Optimizely, or Google Optimize.
Defined goals and hypotheses for each test.
Steps:
Choose the test element: Select one of the top 10 elements to test based on your marketing goals.
Create variants: Develop two or more versions of the selected element. Ensure that the changes are significant enough to potentially influence user behavior.
Set up the test: Use your A/B testing tool to set up the experiment. Define the audience, duration, and success metrics.
Run the test: Launch the experiment, ensuring that traffic is evenly split between the variants.
Analyze results: After the test concludes, analyze the data to determine which variant performed better against your success metrics.
Implement findings: Apply the winning element to your website and monitor the long-term impact on performance.
Get started now!

The continuous testing cycle
A/B testing is not a one-time activity but a continuous process of learning and optimization.
By systematically testing different elements on your website, you can gain insights into user preferences and behaviors, leading to incremental improvements that can have a substantial impact on your marketing success.
For those looking to delve deeper into A/B testing strategies and advanced techniques, consider exploring resources like Low-code (Sidecar) Experiments or Landing Page Experiments.
Request a demo
