When should someone use a switchback test instead of an A/B test?
Switchback experiments are a way to measure the impact of a change when network effects render traditional A/B tests impractical, as is often the case in 2-sided marketplace products.
A canonical example of this scenario comes from ridesharing services like Lyft: All the riders in an area share the same supply of drivers, and vice versa. In these cases, a test that impacts the probability of riders booking a ride (e.g., providing a discount code) also affects the supply of drivers available to the control group.
Since the test and control groups are not independent, a simple A/B test will produce inaccurate results.
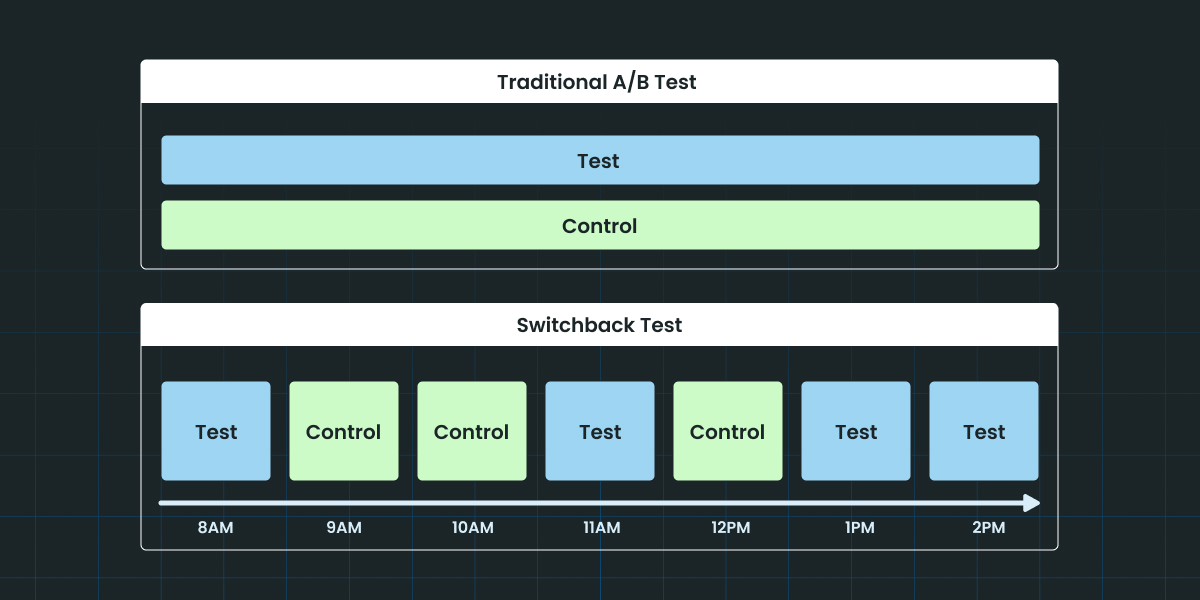
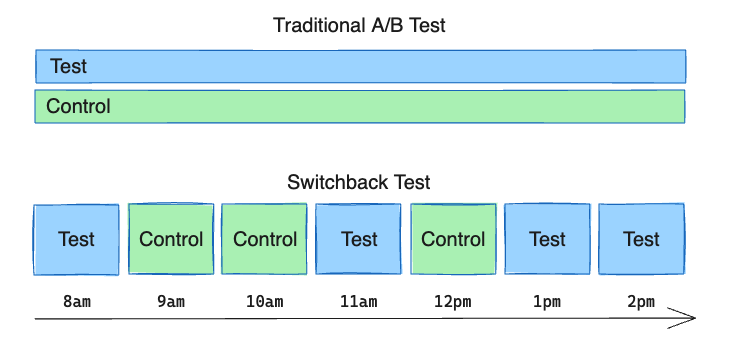
Switchback experiments solve this problem by switching between test and control treatments based on time, rather than randomly splitting the population. At any given time, everyone in the same network receives the same treatment. Over time, we flip between test and control and collect metrics for both, which we can compare to evaluate the impact of our change.

Questions about switchback testing?

Implementation
At the most basic level, the minimum requirement for setting up a switchback experiment is determining the time interval for switching.
The interval should be long enough to capture the effect we want to measure, but also short enough to allow for as many test and control samples as possible. Additionally, we want to achieve an even sampling of test and control across times of day and days of the week over the course of the experiment. A common solution for this is to set the experiment duration in 2-week intervals.
Once the switching time window is set, we create a schedule that defines which intervals will be test and which ones will be control. There are different strategies for setting the schedule, ranging from simply random assignment to more complex algorithms that can be optimized based on knowledge of the product and effect being tested.
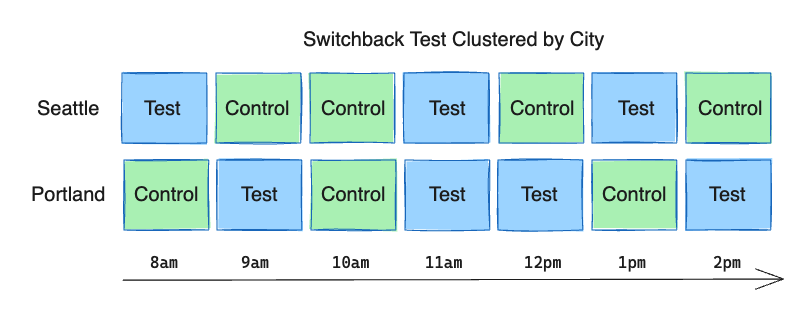
In addition to time intervals, it’s also possible to segment users into independent clusters, such as cities. The treatment at each interval can then be assigned separately for each cluster. This provides better sampling of test and control at different times of day and increases our total test and control data points, which helps reduce the variance and increase the power of the test.

Finally, it may also be helpful to apply burn-in and burn-out periods to exclude users who are exposed to the experiment at a time near the switching boundary, since they may be influenced by both the test and control experiences.
Say a rider opens their app at 9:03 am and receives the control treatment. Only 3 minutes have passed since the switch from test to control, so the driver availability is still heavily impacted by the spillover effect of the test treatment during the previous hour.
We want to exclude this user’s metrics from the analysis to avoid cross-contamination of test and control effects in our metrics. For example, a switchback window of 1 hour with 5-minute burn-in and burn-out periods would only include exposures that fire during the middle 50 minutes of the window.

Analysis
The standard t-test commonly used for traditional A/B tests is not recommended for switchback. experiments:
A user-level or session-level unit of analysis would violate the requirement for independent observations. We already know there are network effects at play and the actions of one user can impact another.
We could treat each cluster and time interval as a unit, but this would likely lead to underpowered experiments since the total number of units would be low. For example, a 2-week experiment with a 1-hour switchback window and 5 clusters would give us only 1680 total units.
A common approach is to use regression analysis, as in this example from Doordash. The idea is that the response variable (our metric of interest) can be represented as a combination of known variables and unknown variables. The known variables can include the control value of the metric, seasonality effects, etc. The unknown variable would be our treatment effect.
This approach may be ideal when the regression model can be tailored to a specific metric and product. However, it’s difficult to generalize this as an out-of-box solution that can guarantee goodness of fit for any metric in a variety of product use cases. At Statsig, we’ve elected to use bootstrapping analysis, as it can more easily be generalized to any metric without assumptions about its behavior.
Request a demo

Summary
Switchback experiments are the industry standard approach to A/B testing in 2-sided marketplaces. They allow us to measure the impact of a change without the bias from network effects often present in these products. There are also limitations; due to their alternating nature, switchback tests are not well-suited for measuring long-term effects. Rather, they are ideal for understanding transactional user behaviors that tend to be contained within a single session.
Some forethought is needed when setting up successful switchback tests. Selecting the appropriate switching time window for the product or feature in question is critical for picking up the real effect and controlling the network effects.
Adding a clustering dimension such as city or job category can also help increase the number of distinct data points we collect, but we must choose clusters that are independent from each other. The optimal time and clustering parameters will vary from product to product, so domain knowledge plays a key role in this process.
Get started now!
