Products
Solutions
Resources


At Statsig, our vision is to be the one-stop data tool that software companies need to build great products.
Today, we're announcing the launch of Statsig Warehouse Native.
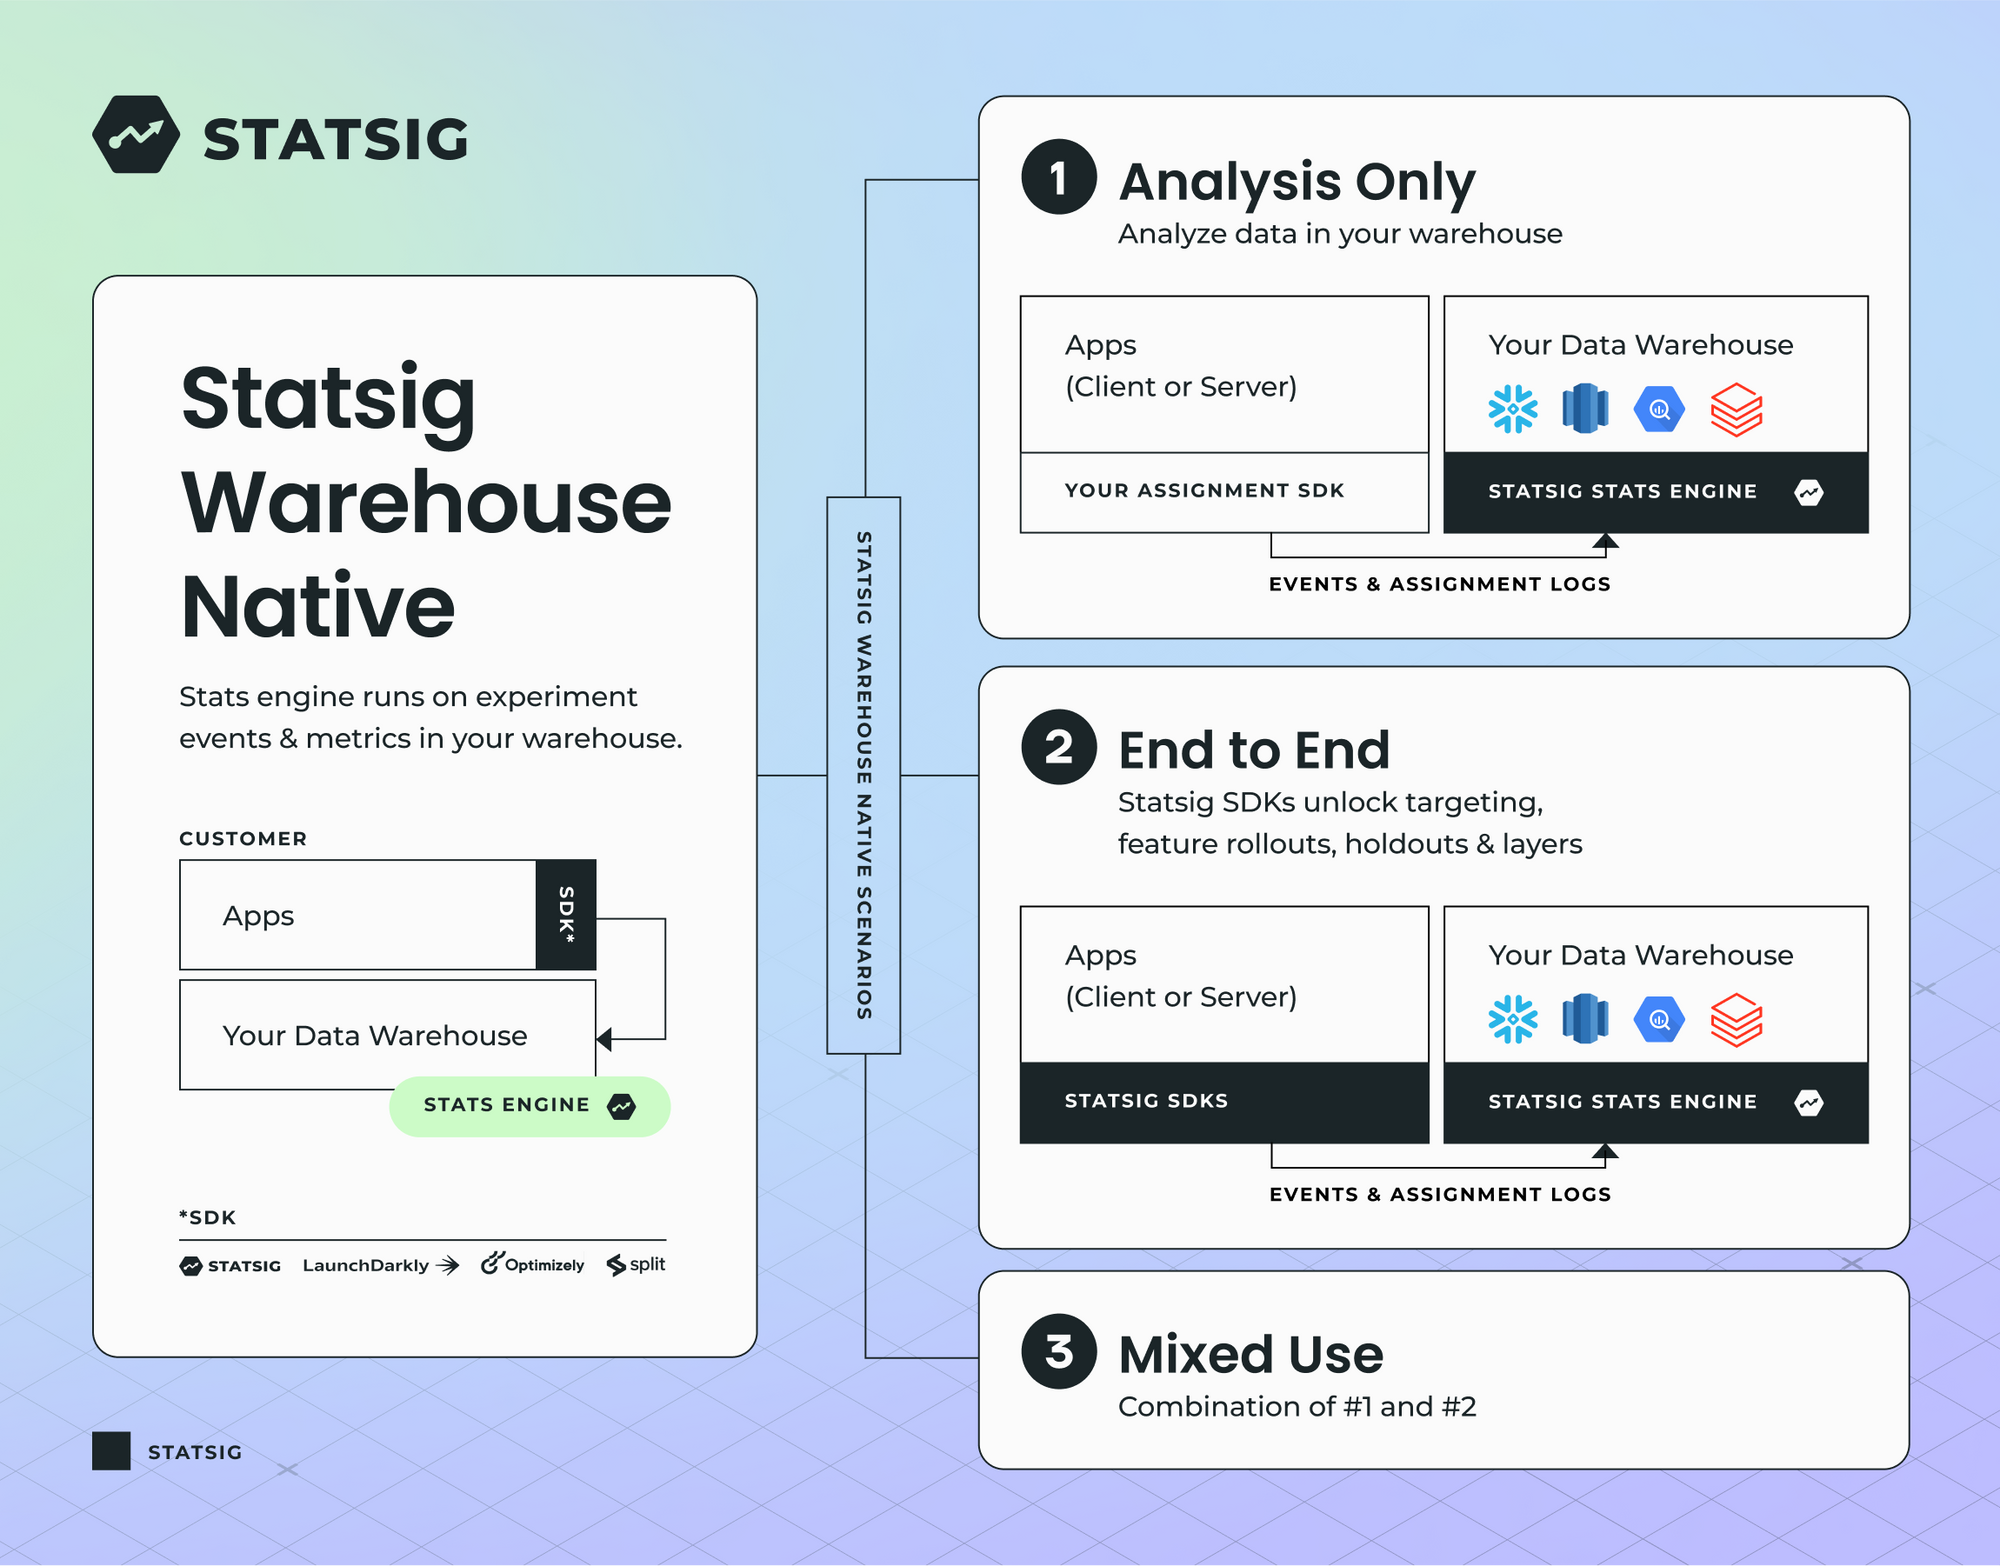
Starting right now, customers on BigQuery, Snowflake, Databricks, and Redshift can add Statsig Warehouse Native to their product stack and unlock:
Experiment analysis that runs inside the data warehouse from existing source-of-truth datasets.
A robust stats engine equipped with CUPED, sequential analysis, as well as holdouts and layers (universes) for more sophisticated experimentation.
Complete visibility into analysis with no-code tools to segment and drill down into results.
Integrated SDKs supporting feature flags, experimentation, remote configuration, and other tools for managing software releases.
Product insights, and dashboards for comprehensive data-driven decision-making.
Enterprise-grade change management features including role-based access control, approval workflows, and auditing capabilities.
Always improving
Our initial product centered on critical engineering tools: great SDKs, dynamic config, and feature flags. By building with flags and logging metrics, teams could easily deploy, monitor, and analyze the impact of new features and experiments. Thousands of experiments have been launched and analyzed using Statsig this way.
When companies build from the ground up using our feature management tools, they automatically get full visibility into how new features impact their users and business metrics. Every feature gate becomes an experiment, with no overhead.
As our business has grown, we’ve gotten valuable feedback from product and data science leaders who value quick iteration, governance, and the ability to avoid duplicating core business metrics in multiple systems. Today, we’re excited to announce a new offering that delivers on those needs: Statsig Warehouse Native.
Statsig Warehouse Native
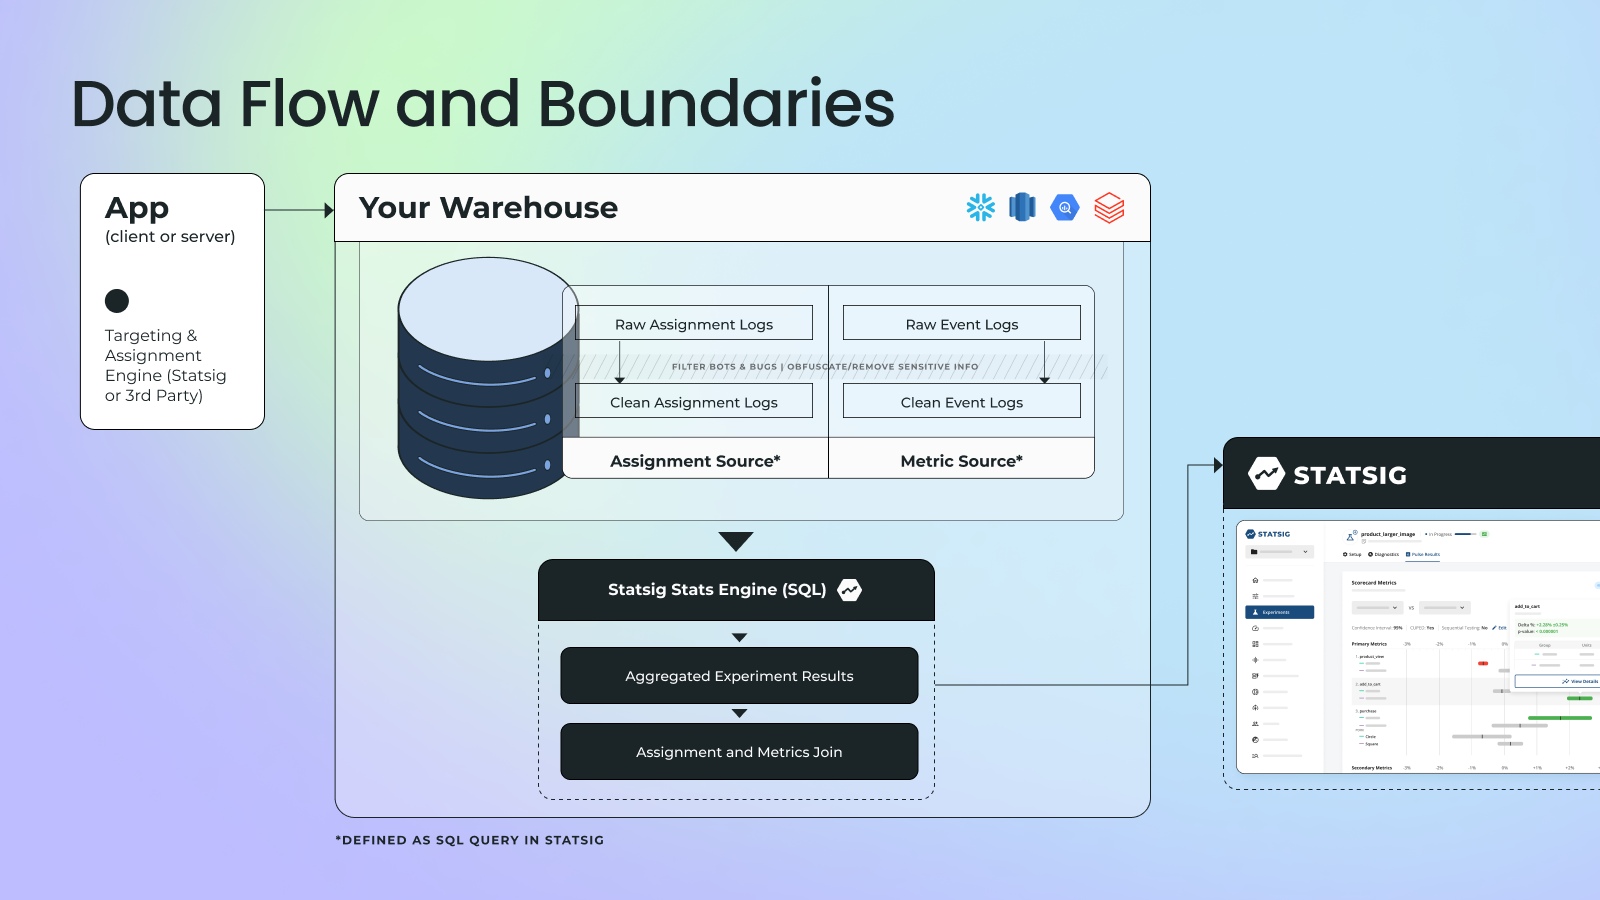
Statsig Warehouse Native brings Statsig’s stats engine into your data warehouse. It’s fast, modular, and runs on your datasets. It’s built for experiment analysis, using the same methodology that our team deploys to process billions of rows of data every day. Our stats engine is fully transparent, providing access to the underlying SQL queries, statistical methodology, and intermediate datasets.
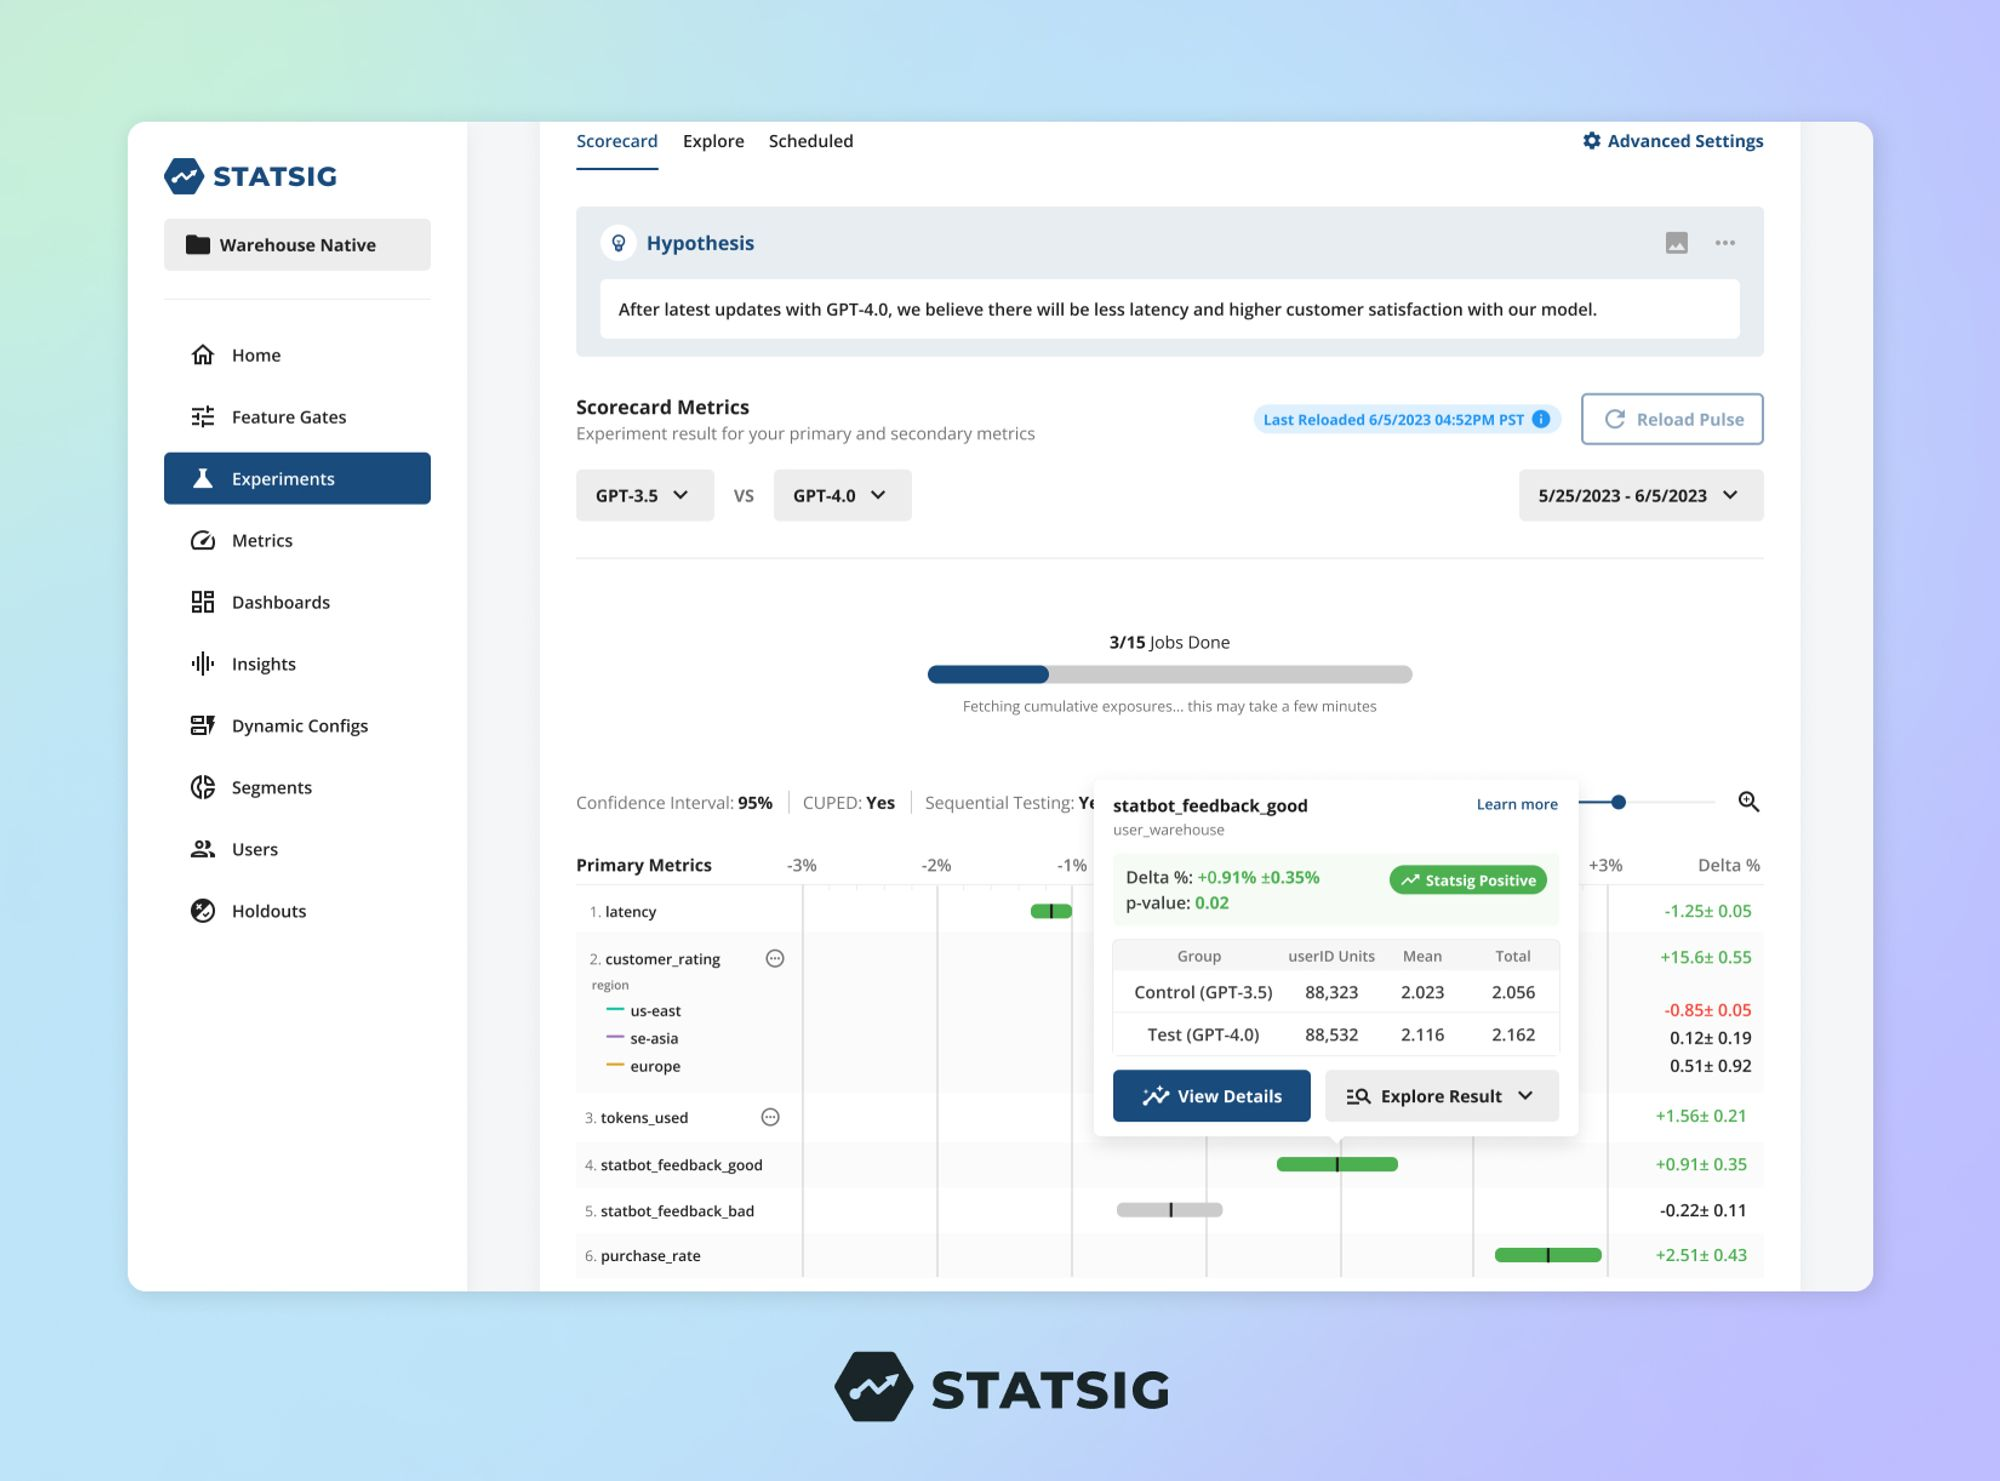
With Statsig Warehouse Native, data and product teams can streamline their entire experimentation workflow. Simply provide connections to the exposures and metrics tables, hit run, and see results populate in the Statsig UI immediately (most computations take less than 5 minutes).
Once connected to Statsig, product teams can understand the impact of their changes using Statsig’s pulse results and full suite of analysis tools like drill-downs, metric dimensions, and time-series deltas.
Importantly, Statsig Warehouse Native can be configured to meet your team’s specific needs. Regardless of what tool you use to handle assignment, event logging, and metric computation, this will work for you. Your exposures from a separate feature flagging vendor, the metrics you log to your product analytics tool, and your growth metrics catalog will all play nicely together.
If you want to leverage Statsig’s SDKs to handle assignment and event logging, that’s great too! We’ll send data directly to your data warehouse, so you’re in full control.
More insights in less time
Data scientists don’t want to spend all day re-computing experiment results for product and growth teams. They want to help their teams make better decisions. We hope that with this product, data teams can spend less time computing, and more time on the things they love: deriving unique insight from data.
This new suite of tools provides unmatched flexibility for product and data leaders, enabling a dramatic increase in experimentation velocity at any scale, with the most advanced experimentation tools out there.
Statsig saves our team over 12 hours of analyst time per experiment by seamlessly integrating with our existing Snowflake data.
Mark Phuong, Sr. Data Scientist, Black Crow AI
Introducing Statsig Warehouse Native

Why build with Statsig?
We are on a mission to bring the sophisticated tools—used by big tech companies to stay ahead of the game—to developers, data scientists, and product managers everywhere.
To that end, we launch multiple new features a month—often at our users' request—and keep track of them in an indexable list to make sharing easier! We also keep our documentation public, and our experimentation community open. When you build with Statsig, you build with velocity.
Thanks for reading—and as always, happy building!
Get started now!
