The 95% confidence interval currently dominates online and scientific experimentation; it always has.
Yet its validity and usefulness is often questioned. It’s called too conservative by some [1], and too permissive by others. It’s deemed arbitrary (absolutely true), but that’s a good thing! I’m a proponent of 95% confidence intervals and recommend them as a solid default.
There’s a reason it’s been the standard from the very start of modern statistics, almost 100 years ago. And it’s even more important now in the era of online experimentation. I’ll share why you should make 95% your default, and when and how to adjust it.
What is a 95% confidence interval?
This is a common term in experimentation, but like p-values, it’s not intuitive. Even Ivy League stats professors can get it wrong [2]. By the book, a 95% confidence interval is a numerical range that, upon repeated sampling, will contain the true value 95% of the time. In practice, it serves as:
A range of plausible values
A measure of precision
An indicator of how repeatable/stable our experimental method is
(These are technically incorrect interpretations, but I’ll defer to those more educated on this topic [3]).
Perhaps the most valuable and correct use of a 95% confidence interval is as a cutoff for rejecting the null hypothesis. This is also known as a 5% significance level (100% - 95% = 5%). Your hard-fought experiments, and oftentimes hopes and dreams, instantly become successes or failures. There is no middle ground.
Confidence intervals don’t distinguish between absolutely zero effect (p=1.0) or close calls (p=0.051). Both scenarios reach the same conclusion: there is no true experimental effect. The plushness of random error is rudely sliced into a yes/no evaluation.
Get more confidence!

Why 95% confidence intervals are useful cutoffs
Thus if there were no 5% level firmly established, then some persons would stretch the level to 6% or 7% to prove their point. Soon others would be stretching to 10% and 15% and the jargon would become meaningless.
Irwin D. J. Bross
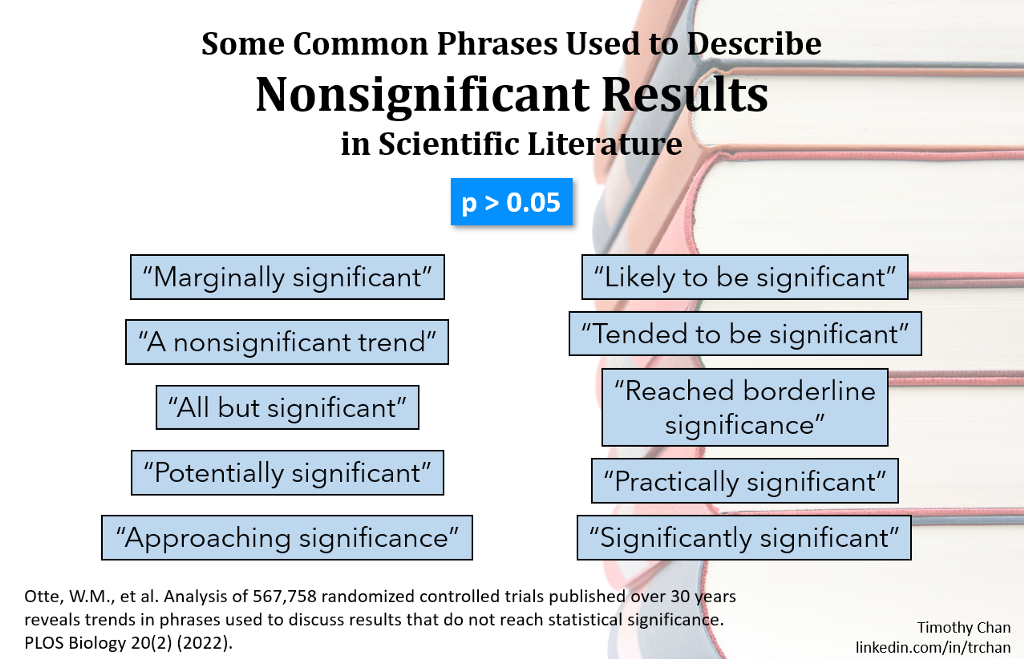
It’s this callous nature that makes 95% confidence intervals so useful. It’s a strict gatekeeper that passes statistical signal while filtering a lot of noise out. It dampens false positives in a very measured and unbiased manner. It protects us against experiment owners who are biased judges of their own work. Even with a hard cutoff, scientific authors comically resort to creative language to color borderline results and make them something more.

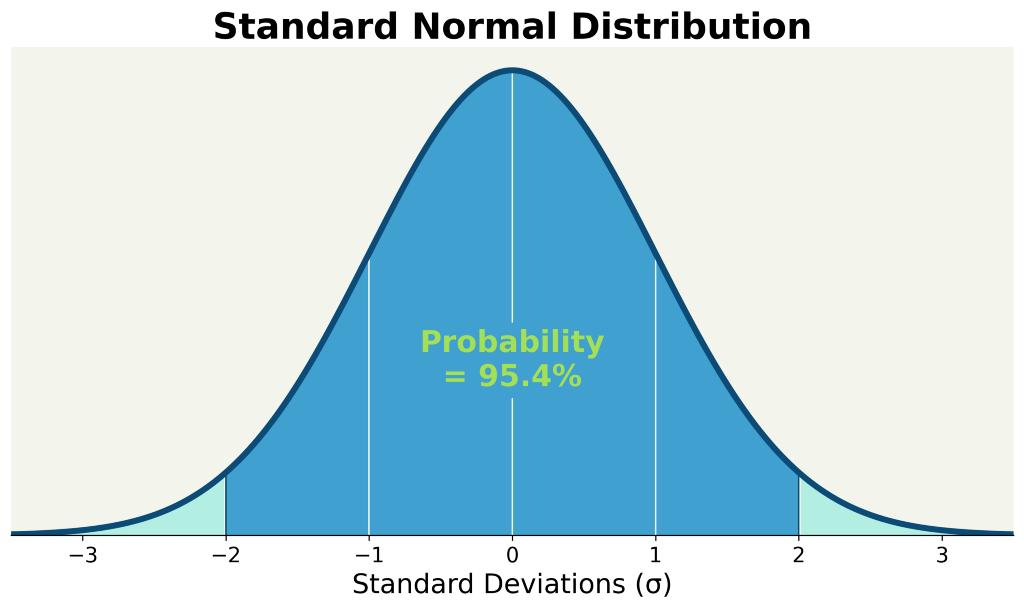
But why 95%? It was set by the father of modern statistics himself, Sir Ronald Fisher [5]. In 1925, Fisher picked 95% because the two-sided z-score of 1.96 is almost exactly 2 standard deviation [6]. This threshold has since persisted for almost a century.

95% should be your default confidence interval
But even though this is an arbitrary number, there are many reasons to use it:
It’s unbiased. Using what others use is defensible. You’ve decided to play by the same rules that others play by. Attempts to change this number (e.g., 90% or 99%) can be viewed as subjective manipulations of the experiment rules. It’s like a trial lawyer defining what “beyond a reasonable doubt” actually means.
It’s a reasonably high bar. It represents a 1 in 20 chance of finding a significant result by pure luck (with no experimental effect). This removes 95% of potential false positives and serves as a reasonable filter of statistical noise.
It’s a reasonable low bar. In practice, it’s an achievable benchmark for most fields of research to remain productive.
It’s ubiquitous. It ensures we’re all speaking the same language. What one team within your company considers significant is the same as another team.
It’s practical. It’s been argued that since p=0.05 remains the convention, it must be practically useful [7]. If it were too low, researchers would be frustrated. If it were too high, we would have a lot of junk polluting our research. Fisher himself used the same bar throughout his career without adjusting this bar.
It’s an easy choice. Fine-tuning your confidence interval in a defensible and unbiased manner requires some work. In most cases, it’s a better use of your time to formulate ideas and focus on running experiments.
Request a demo

How to pick a custom confidence interval
For all the reasons above, I recommend most experimentalists default to use 95%. But there are a few good reasons why you should adjust it:
Your risk-benefit profile is unique. You may either have a low tolerance for false positives or false negatives. For example, startup companies that have a high risk tolerance will want to minimize false negatives by selecting lower confidence intervals (e.g., 80% or 90%). People working on critical systems like platform integrity, or life-saving drugs may want to minimize false positives and select higher confidence intervals (e.g., 99%).
You have the wrong amount of statistical power. You’ve run power calculations that fail to produce a reasonable sample size estimate. In some cases, you have too few samples and can reverse-engineer your confidence interval. In other cases, you may be blessed with too many samples and can afford to cut down your false positive rate. (This is a big data problem!)
Selecting a custom confidence interval trades off between false positive and false negative rates. Lowering the bar by shrinking your confidence interval (to say 90%) will increase your false positive rate, but decrease your false negative rate. This will pick up more real effects but also more statistical noise. Properly tuning this number means matching your risk profile. Properly doing this requires weighing the costs of a false positive against a false negative.
If you choose to venture down this path, I have some guidelines:
Set your confidence threshold BEFORE any data is collected. Cheaters change the confidence interval after there’s an opportunity to peek.
Try to reuse your custom confidence interval. It’s tedious and potentially biased to do this on an experiment-by-experiment basis. It’s much more useful to identify a broad set of situations and experiments where the new confidence interval should be broadly applied.
Wrap up
Most people, especially experimentation beginners, should stick with 95% confidence intervals. It’s a really good default that applies to a lot of situations that doesn’t invite extra questioning. But if you insist on changing it, make sure it matches your situation and risk profile, and do this before you start the experiment.
Learn how to make data-driven decisions

References
Gelman, Andrew (Nov. 5, 2016). “Why I prefer 50% rather than 95% intervals”.
Gelman, Andrew (Dec 28, 2017). “Stupid-ass statisticians don’t know what a goddam confidence interval is”.
Morey, R.D., Hoekstra, R., Rouder, J.N.
et al. The fallacy of placing confidence in confidence intervals. Psychon Bull Rev 23, 103–123 (2016).
Otte, W.M., et al. Analysis of 567,758 randomized controlled trials published over 30 years reveals trends in phrases used to discuss results that do not reach statistical significance. PLOS Biology 20(2) (2022).
Fisher, Ronald (1925).
Statistical Methods for Research Workers. Edinburgh: Oliver and Boyd. p. 46. ISBN 978–0–05–002170–5.
Bross, Irwin D.J. (1971). “Critical Levels, Statistical Language and Scientific Inference,” in Godambe VP and Sprott (eds) Foundations of Statistical Inference. Toronto: Holt, Rinehart & Winston of Canada, Ltd.
Cowles, M., & Davis, C. (1982). On the origins of the .05 level of statistical significance.
American Psychologist, 37(5), 553–558.
Simon, Steve (May 6, 2002). “Why 95% confidence limits?”.


