Products
Solutions
Resources
Measuring the combined impact of multiple features
Your team is busy shipping features, and they are keeping a close eye on product metrics. While it’s easy (with Statsig) to understand the impact of individual feature launches, one question that often comes up is: What’s the collective impact of multiple features?
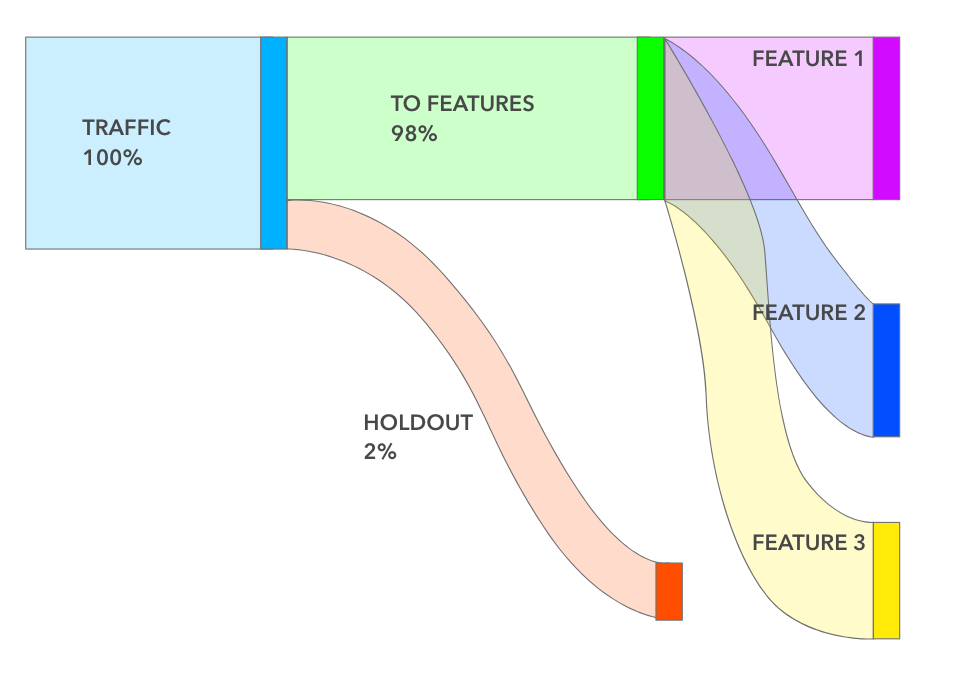
At Facebook, every team calculated the cumulative impact of all features shipped over the last 6 months. And to do that accurately, we use “Holdouts” that we create at the beginning of each half. A holdout is usually small (1–5%) in size, and as the name implies, holds that set of people out of any new features launched during that half.
This provides us with a baseline to measure the cumulative impact of multiple launches over 6 months. At the end of the half, we release that holdout and create a new one for the next half. Holdouts are powerful and have many other uses including measuring long-term effects, quantifying subtle ecosystem changes, and debugging metric movements.

Today, we’re making all this available via Holdouts on Statsig. Setting up a holdout is a cinch — you pick the size and the features you want held from users. You can also make holdouts be ‘global’ which means all new features will automatically respect the holdout. And occasionally (hopefully, sparingly) you might want to run a “back-test” and you can do that by turning on holdouts to an existing set of features.
Once set up, our Pulse engine will automatically compute the impact of all those features compared against the baseline. No additional configuration or code necessary.


Go ahead, try it out today! We have a free plan that allows you to get going right away without needing to talk to any sales teams.