Products
Solutions
Resources
Product Updates
Experiment Assignment (Exposure) Filtering on WHN
For some experiments, assignment and exposure are separate events (e.g. you may need to generate a web page that has an experiment at the bottom of the page. Users are exposed only if the user scrolls down and sees the experiment).
If you are using an assignment tool that logs an exposure event before users are actually exposed to the experiment, you need to filter down the list of users in the assignment source to people who actually saw the experiment.
You can filter the assignment source data based on a Qualifying Event. You can filter assignments to only include subjects that have either generated (or not generated) this qualifying event.
You can find these settings in the Advanced options of the Setup page when creating an Analyze-only Experiment.

Using Statsig SDKs? You don't need to filter!
When using Statsig SDKs you can use getExperimentWithExposureLoggingDisabled on assignment and manuallyLogExperimentExposure at the point of exposure to accurately capture exposure. You don't need to "filter" or clean these exposures.
🧢 Capped Metrics
Today, we’re excited to roll out Capped Metrics. With this capability, you can define max values for a metric for whatever unit type(s) are configured for this metric. Any value surpassing the set cap will automatically be adjusted downward to match it.
For instance, if you determine that purchases greater than $10,000 per day on your E-commerce platform should not skew analysis, any transaction exceeding this threshold will be adjusted downward to this limit, ensuring the integrity of your experiment analysis.
Capped metrics are available for Event Count and Aggregation (sum) metric types. Read more in our docs.

This is rolling out on Statsig Cloud and coming soon on Statsig Warehouse Native.

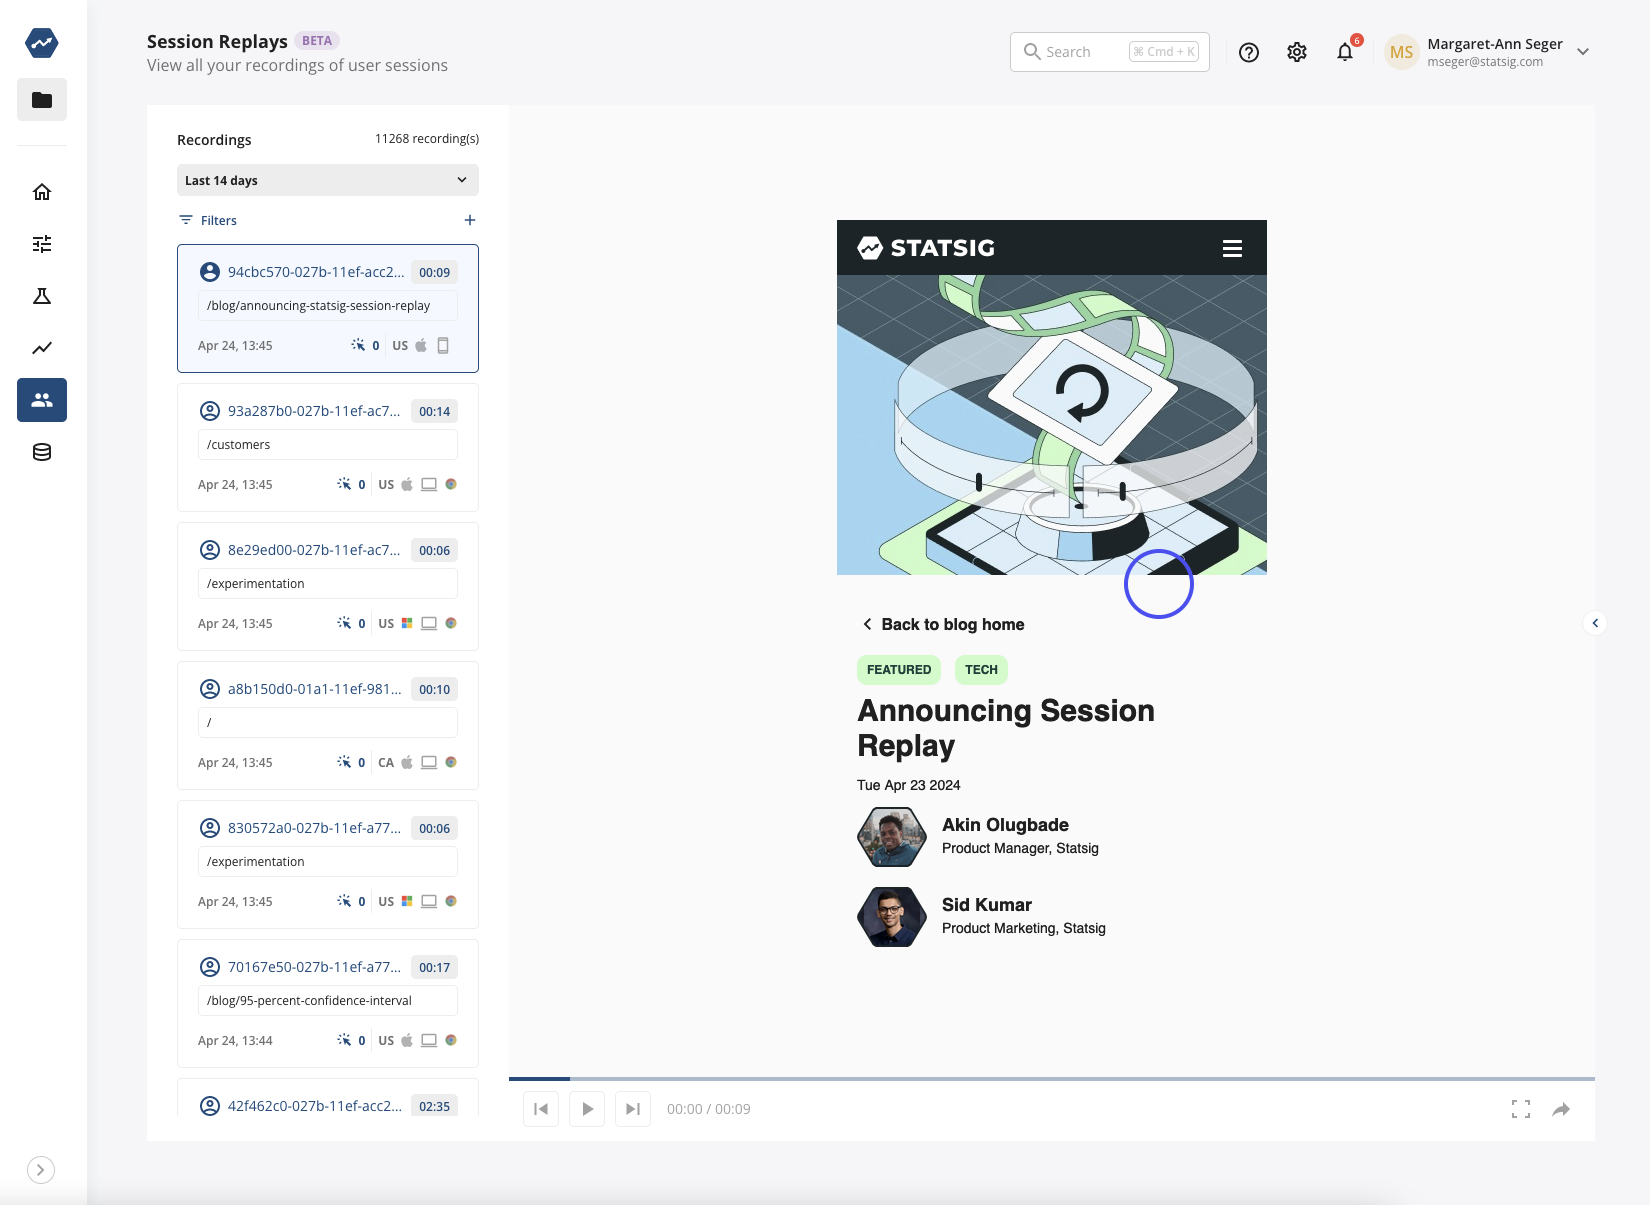
Announcing Session Replay Beta
We're excited to introduce Session Replay, our new tool designed to give you a clearer understanding of how users interact with your product. This feature complements our existing Product Analytics by providing qualitative insights that help explain the reasons behind user behaviors.
Session Replay allows you to visually track a user's journey through your app or website. For example, if Product Analytics shows that users are dropping off at a particular step in a signup or checkout process, Session Replay enables you to see what happened during those sessions. You might discover issues like unclear instructions, overly complex UI, or missing information—factors that could lead to user frustration or abandonment.
For startups, Session Replay is particularly beneficial. We offer 10,000 free session replays each month, making it accessible for new businesses to start optimizing user experiences right away. Setup is straightforward: integrate a code snippet or use a package manager to enable autocapture and begin recording sessions. This tool not only helps identify where users encounter problems but also supports your efforts to make informed decisions to improve design and functionality.
Together with Product Analytics, Session Replay enriches your understanding of user interactions by adding context to the data you collect. This integration helps you make more targeted improvements, enhancing user satisfaction and conversion rates. If you're already using Statsig for Product Analytics, adding Session Replay is a seamless step to gain deeper insights into the 'why' behind the data. Get started today and enhance your ability to observe, analyze, and respond to user needs.
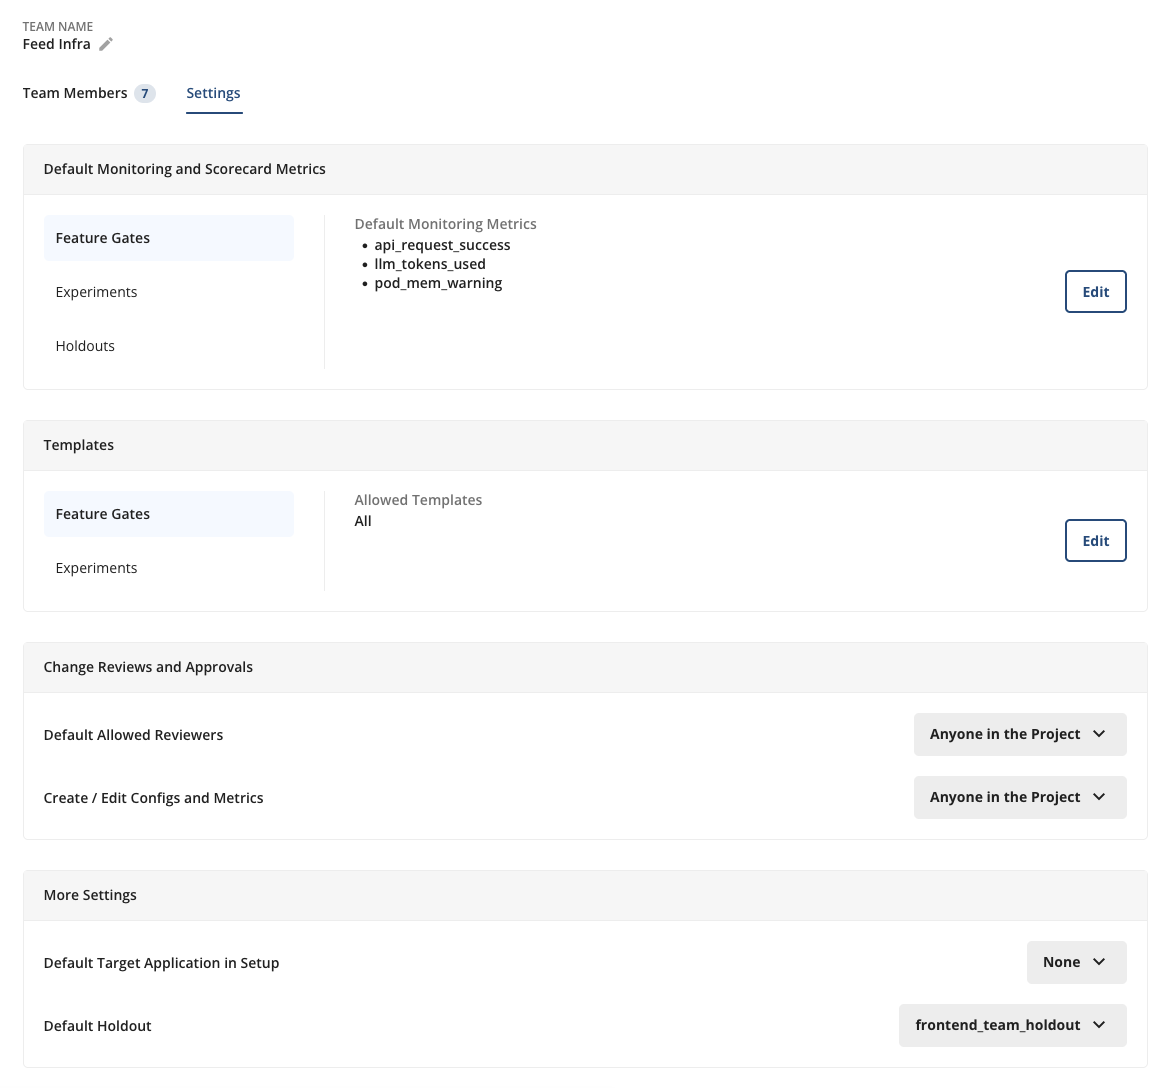
👥 Teams Configuration Settings
We're continuing to build on the recently-launched Teams functionality with a spate of new settings to more granularly control Project Settings at the team-level. New settings include:
Require Teams- Project setting to require all config creations are tied to a team, for easy categorization
Require Reviews- Team-level setting to require reviews at the team level (if reviews aren't already required at the project-level)
Default Holdout- Setting to automatically add all of a team's configs to a specified holdout to track cumulative impact over the course of a Quarter, Half, etc.
Teams are a powerful new organizational mechanism in the Statsig Console to make tracking configs, product changes, and business impact easier than ever at the team level.
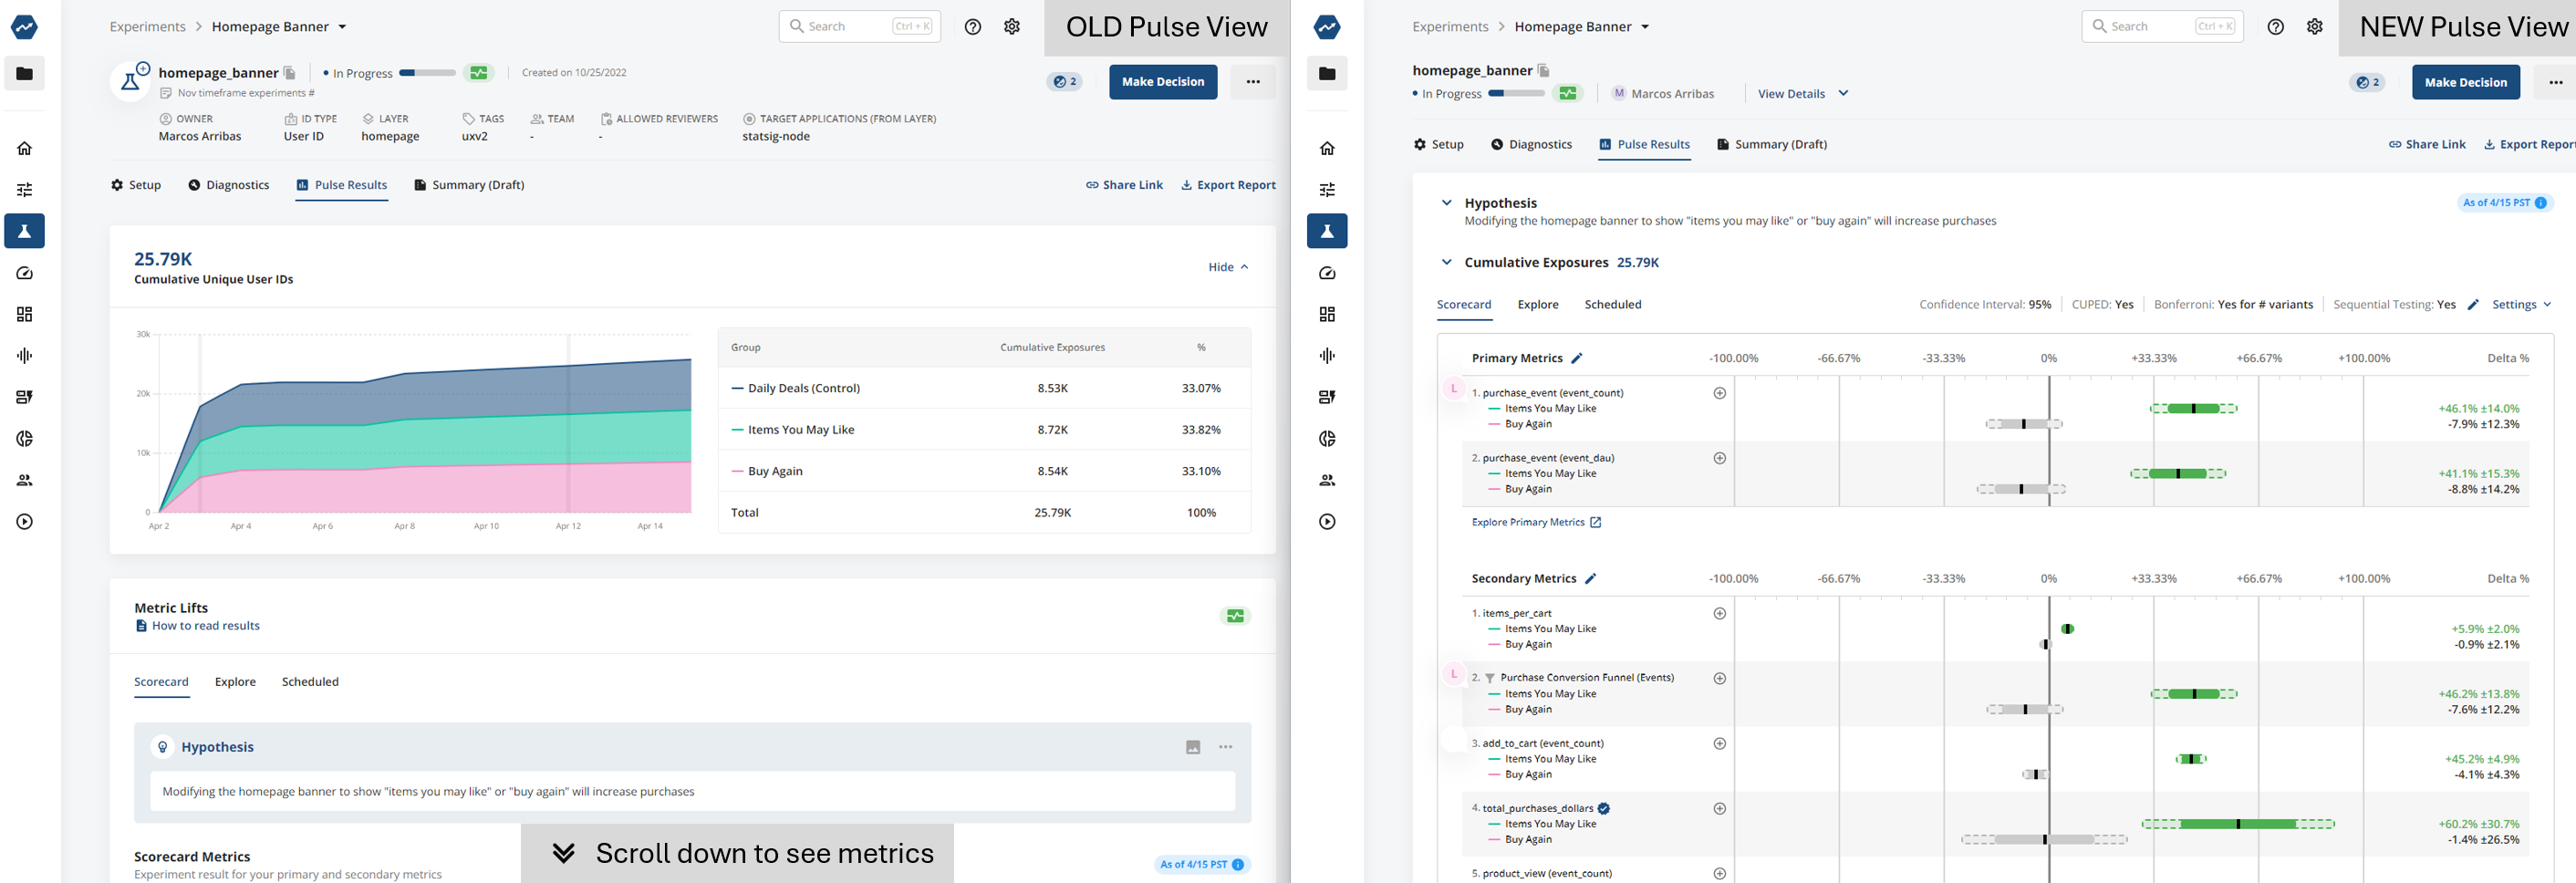
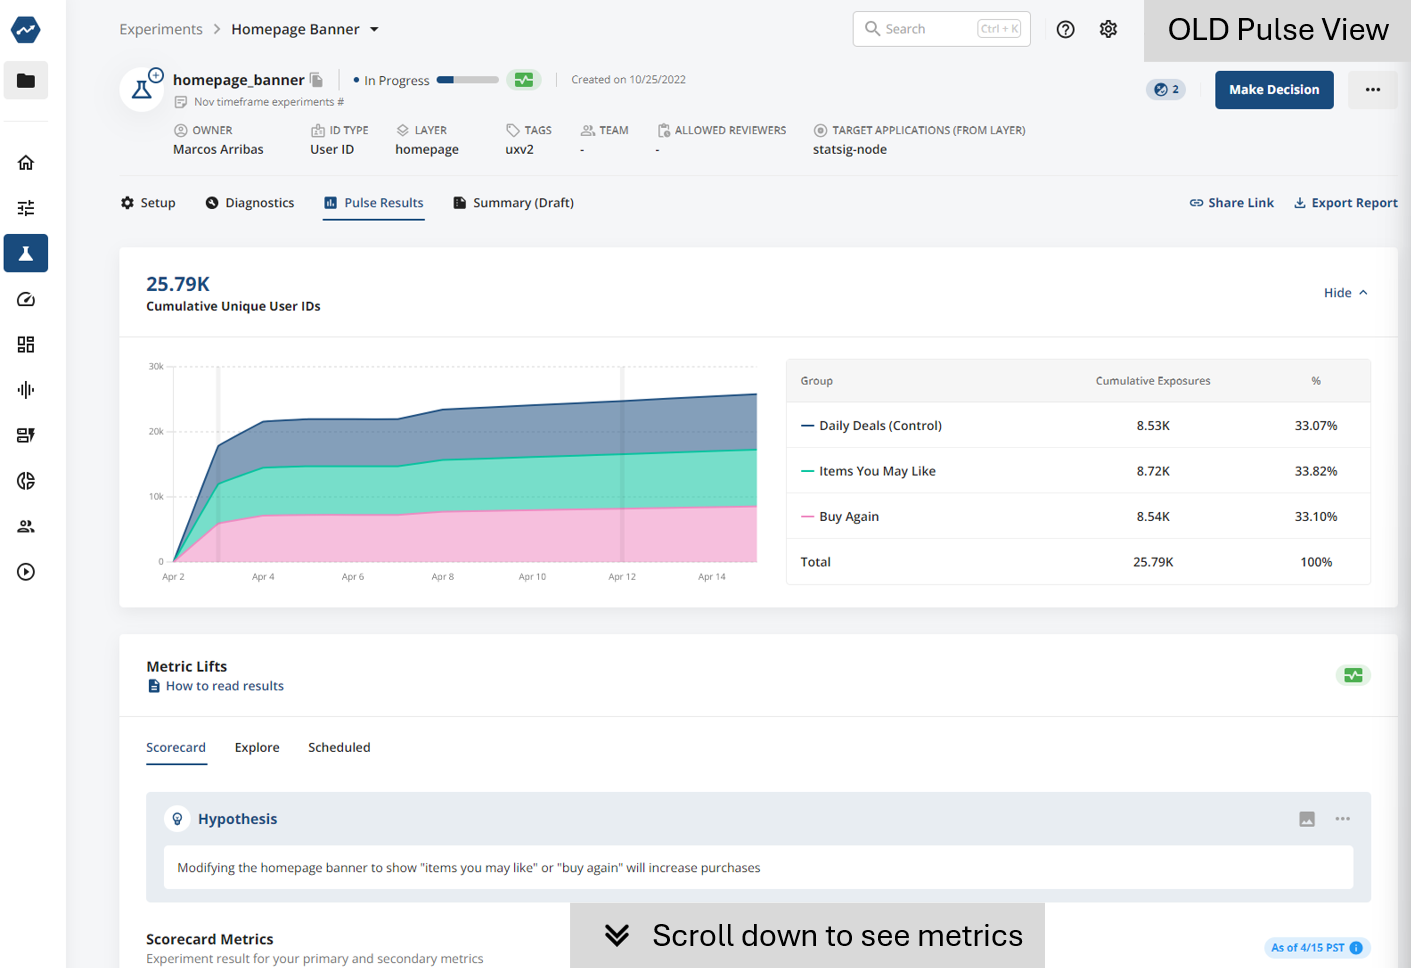
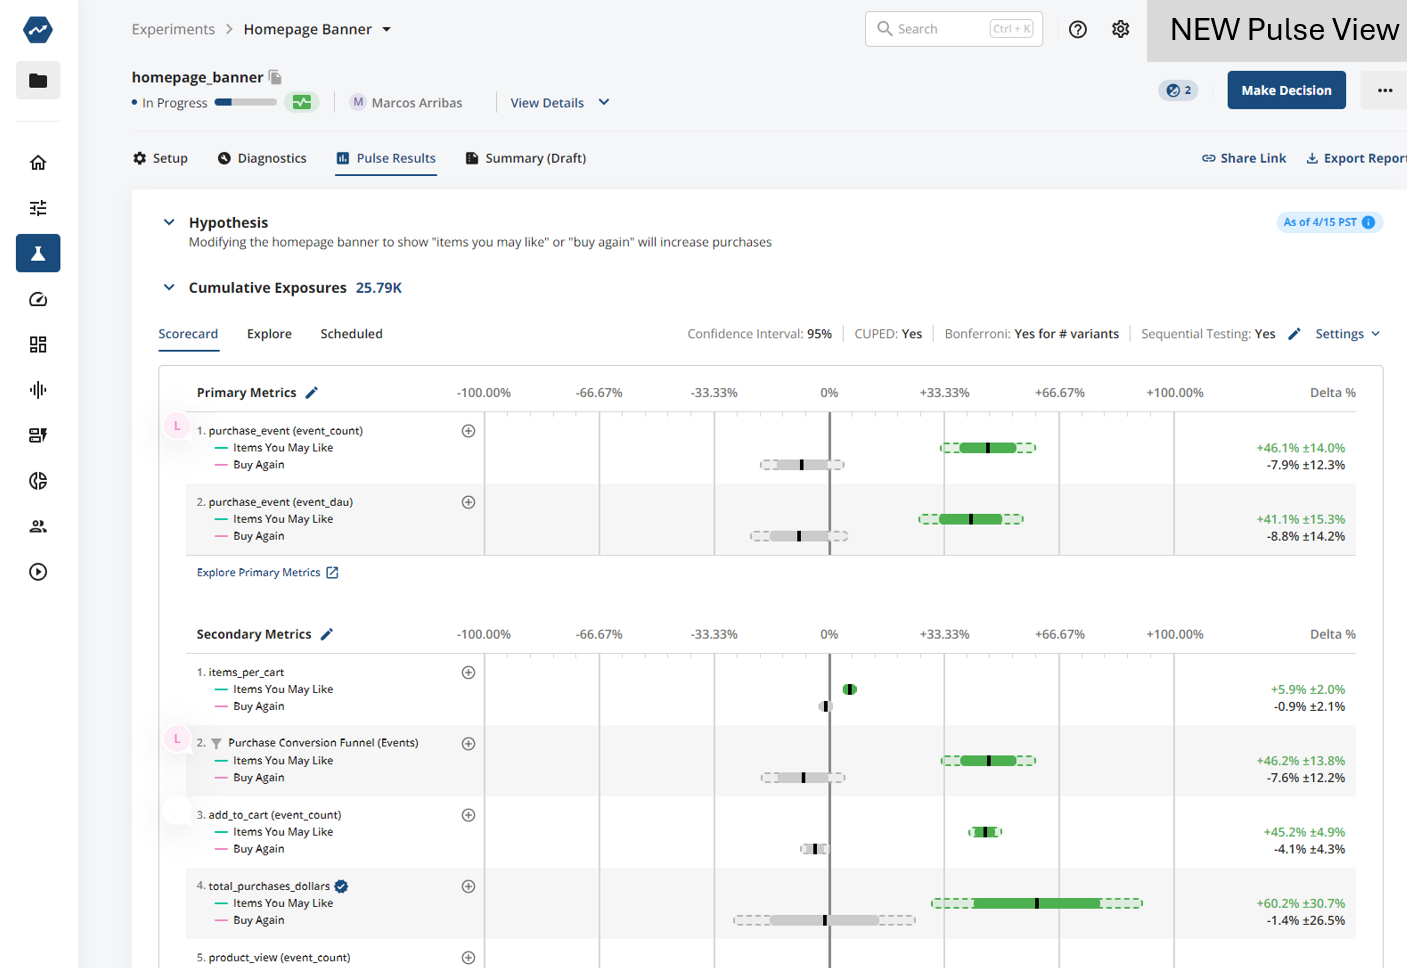
Refreshing Pulse (Experiment Scorecards)
Coming soon to Statsig is a new look to Pulse - our Experiment Scorecard page. As we added more features to this page (Target Apps, Allowed Reviewers, Hypothesis...) metric lifts got pushed off the screen. The new version will bring back focus on the metrics when the experiment is running. You can still access any of the context you're used to with one click.
The Summary tab is unchanged with this refresh. Reach out in Slack with any feedback you have - we're keen to listen as we make this view better.
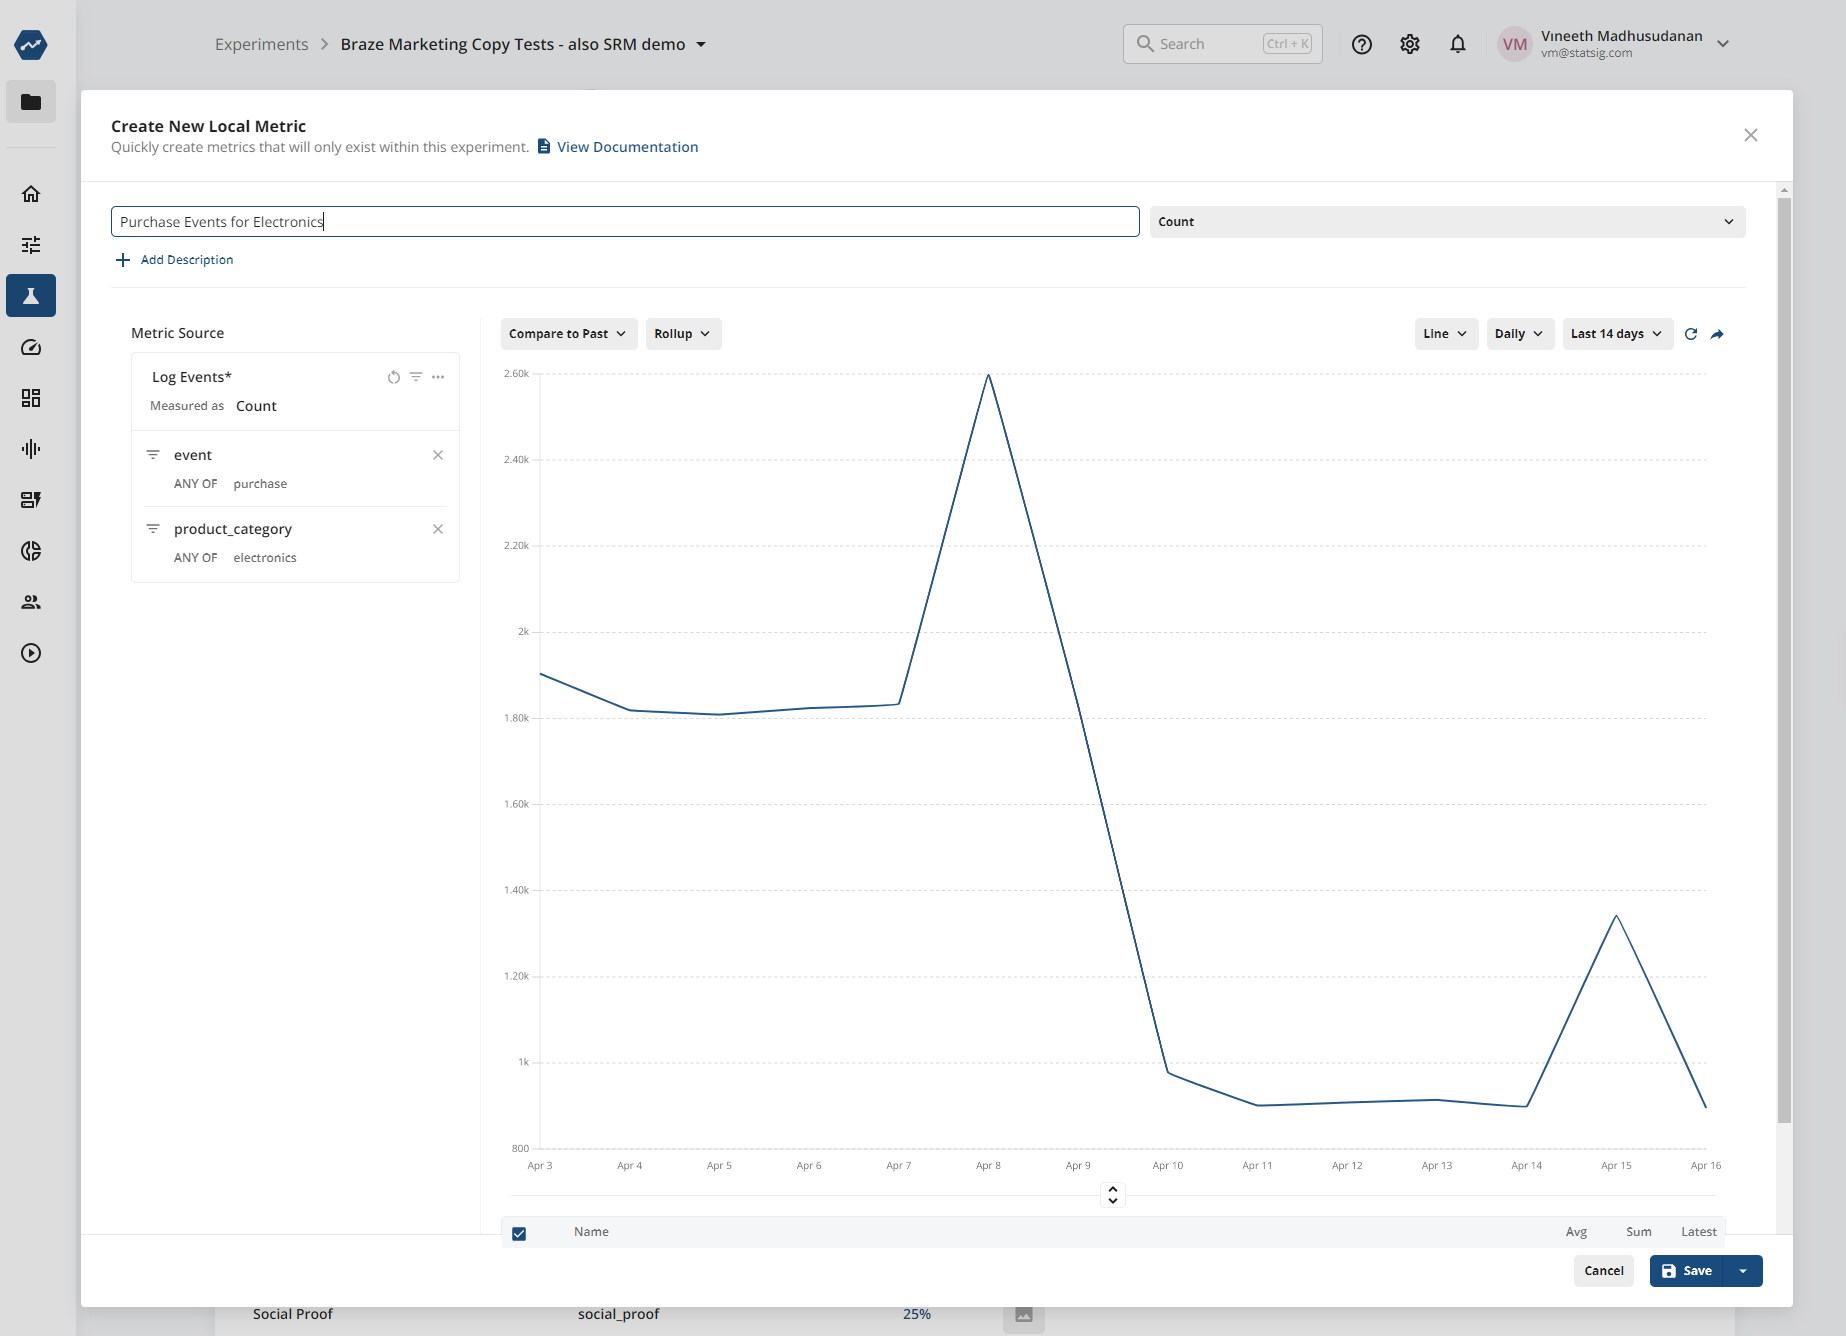
📍 Local Metrics on Warehouse Native
Local Metrics are metrics that are scoped to an individual experiment. They let you create the exact specific custom metric you want to measure in the context of your experiment or gate, without having to clutter up your Metrics Catalog on an ongoing basis.
Local Metrics can be created from the Setup tab sections of your entity, will be calculated for the duration of your experiment or rollout, and then will cease to exist when you make a decision on your experiment.
This rolled out on Statsig Cloud recently, and is now available on Statsig Warehouse Native too.
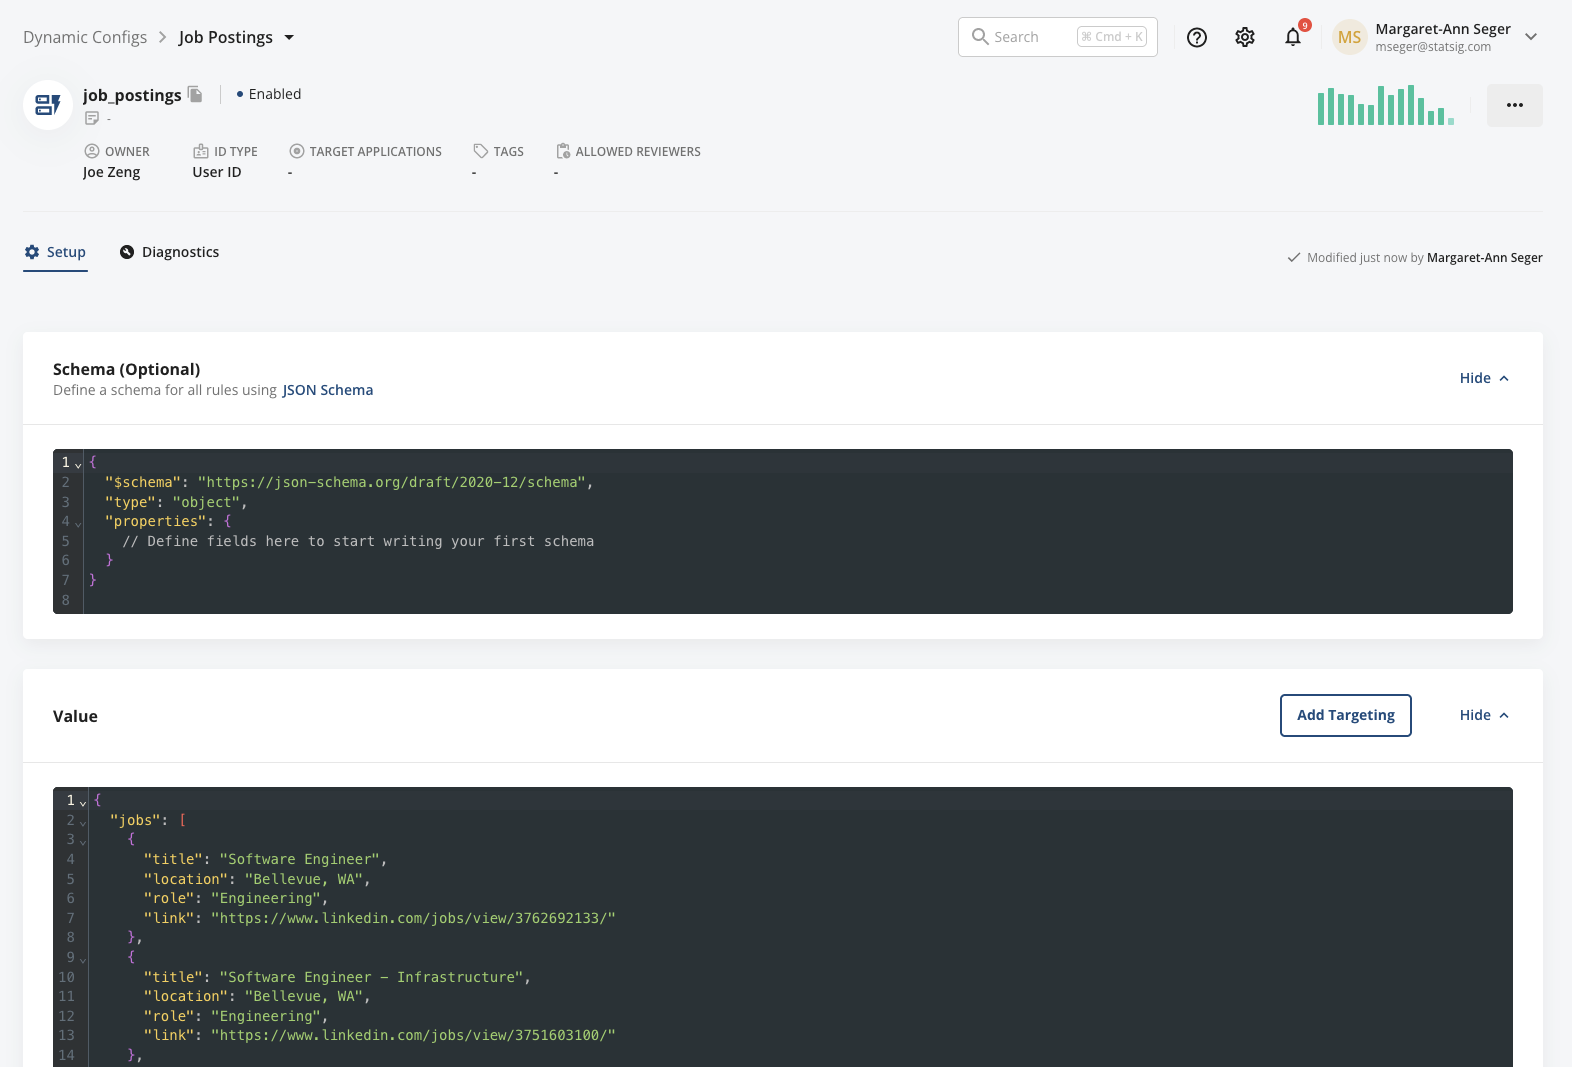
Schemas for Dynamic Configs
Today, we're excited to add the ability to define a schema for your dynamic configs, making it easier and less error-prone for multiple team members to collaborate together on dynamic configs.
To define a schema, you’ll see an optional “Schema” definition unit at the top of the page. When you add a schema, it will validate your rule & default return value JSON against this schema and block saving changes until the return values match the schema.
Inline Comments for Dynamic Configs
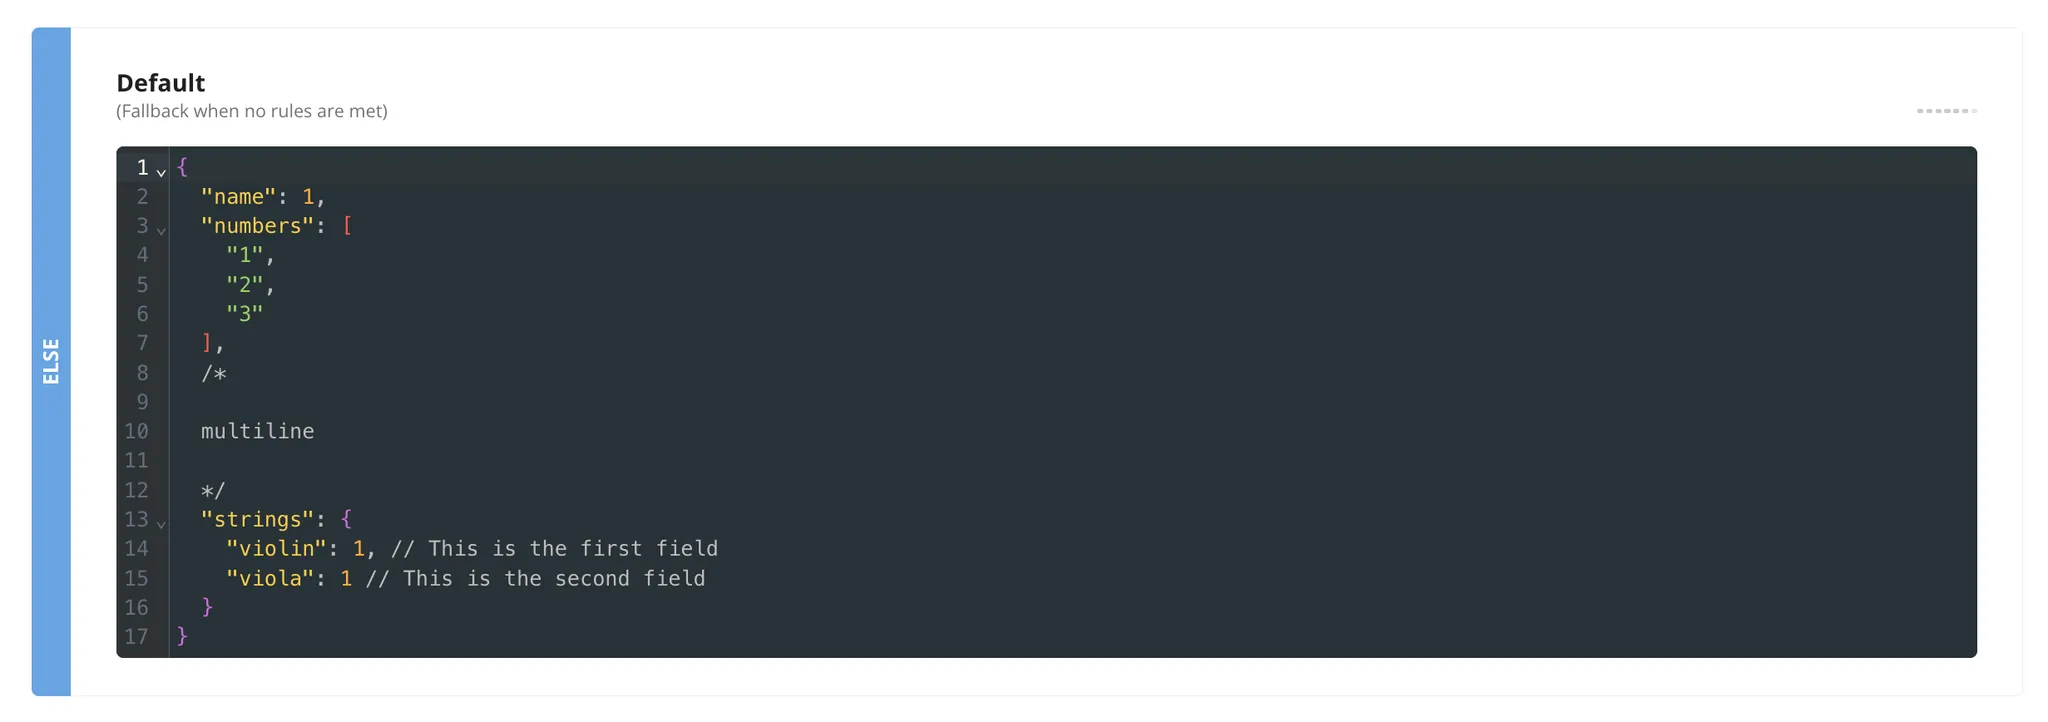
You asked and we answered! One top feature request has been the ability to add inline comments to dynamic configs to help provide clarity and visibility on field values and definitions.
With commenting, you can add comments to any new or existing dynamic config by escaping with "//". Comments will render in the dynamic config editor, but will not be sent down to your SDK.
🧮 More Metric Flexibility on WHN
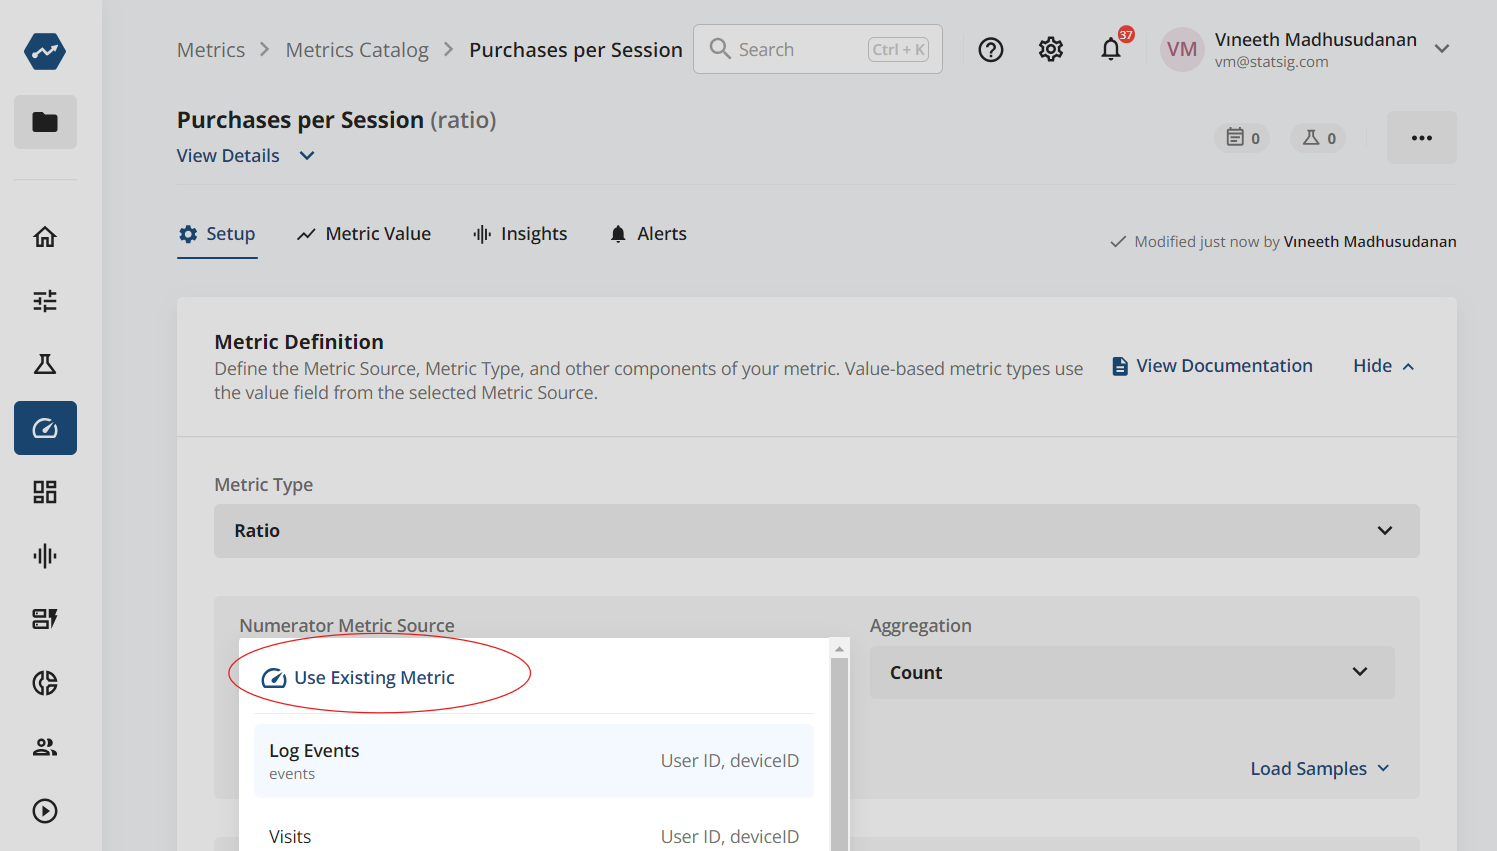
Ratio Metrics: In addition to creating ratio metrics from Metric Sources, you can now create ratio metrics over existing metrics from your metric catalog.
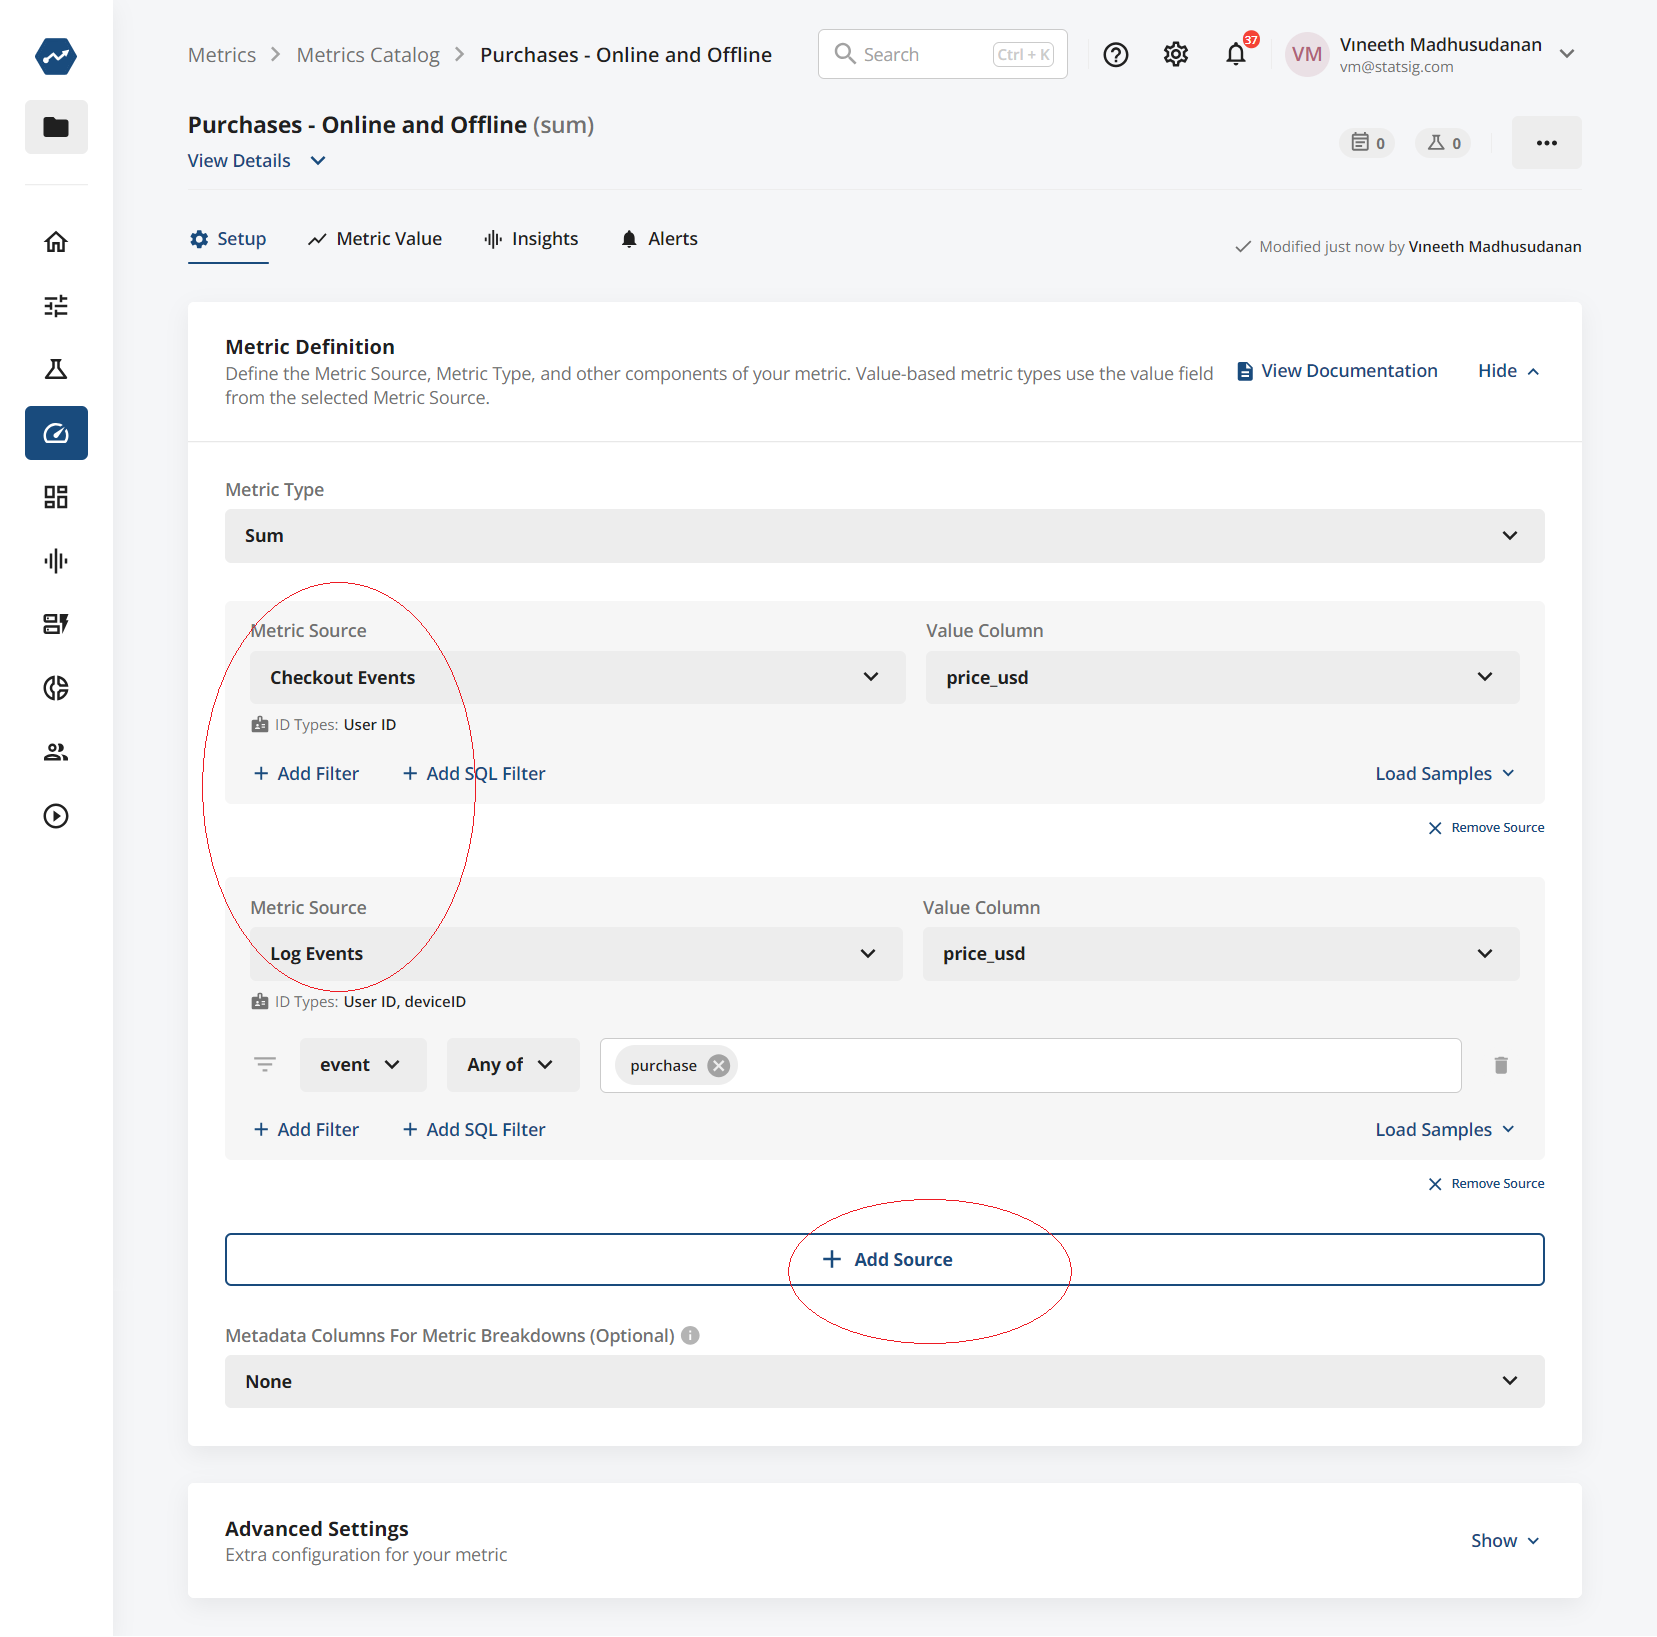
Multi-source metrics: You can now create metrics that span multiple Metric Sources. e.g. If you have setup Online and Offline Purchases as separate metric sources, you can create a metric that sums up purchases from both metric sources.
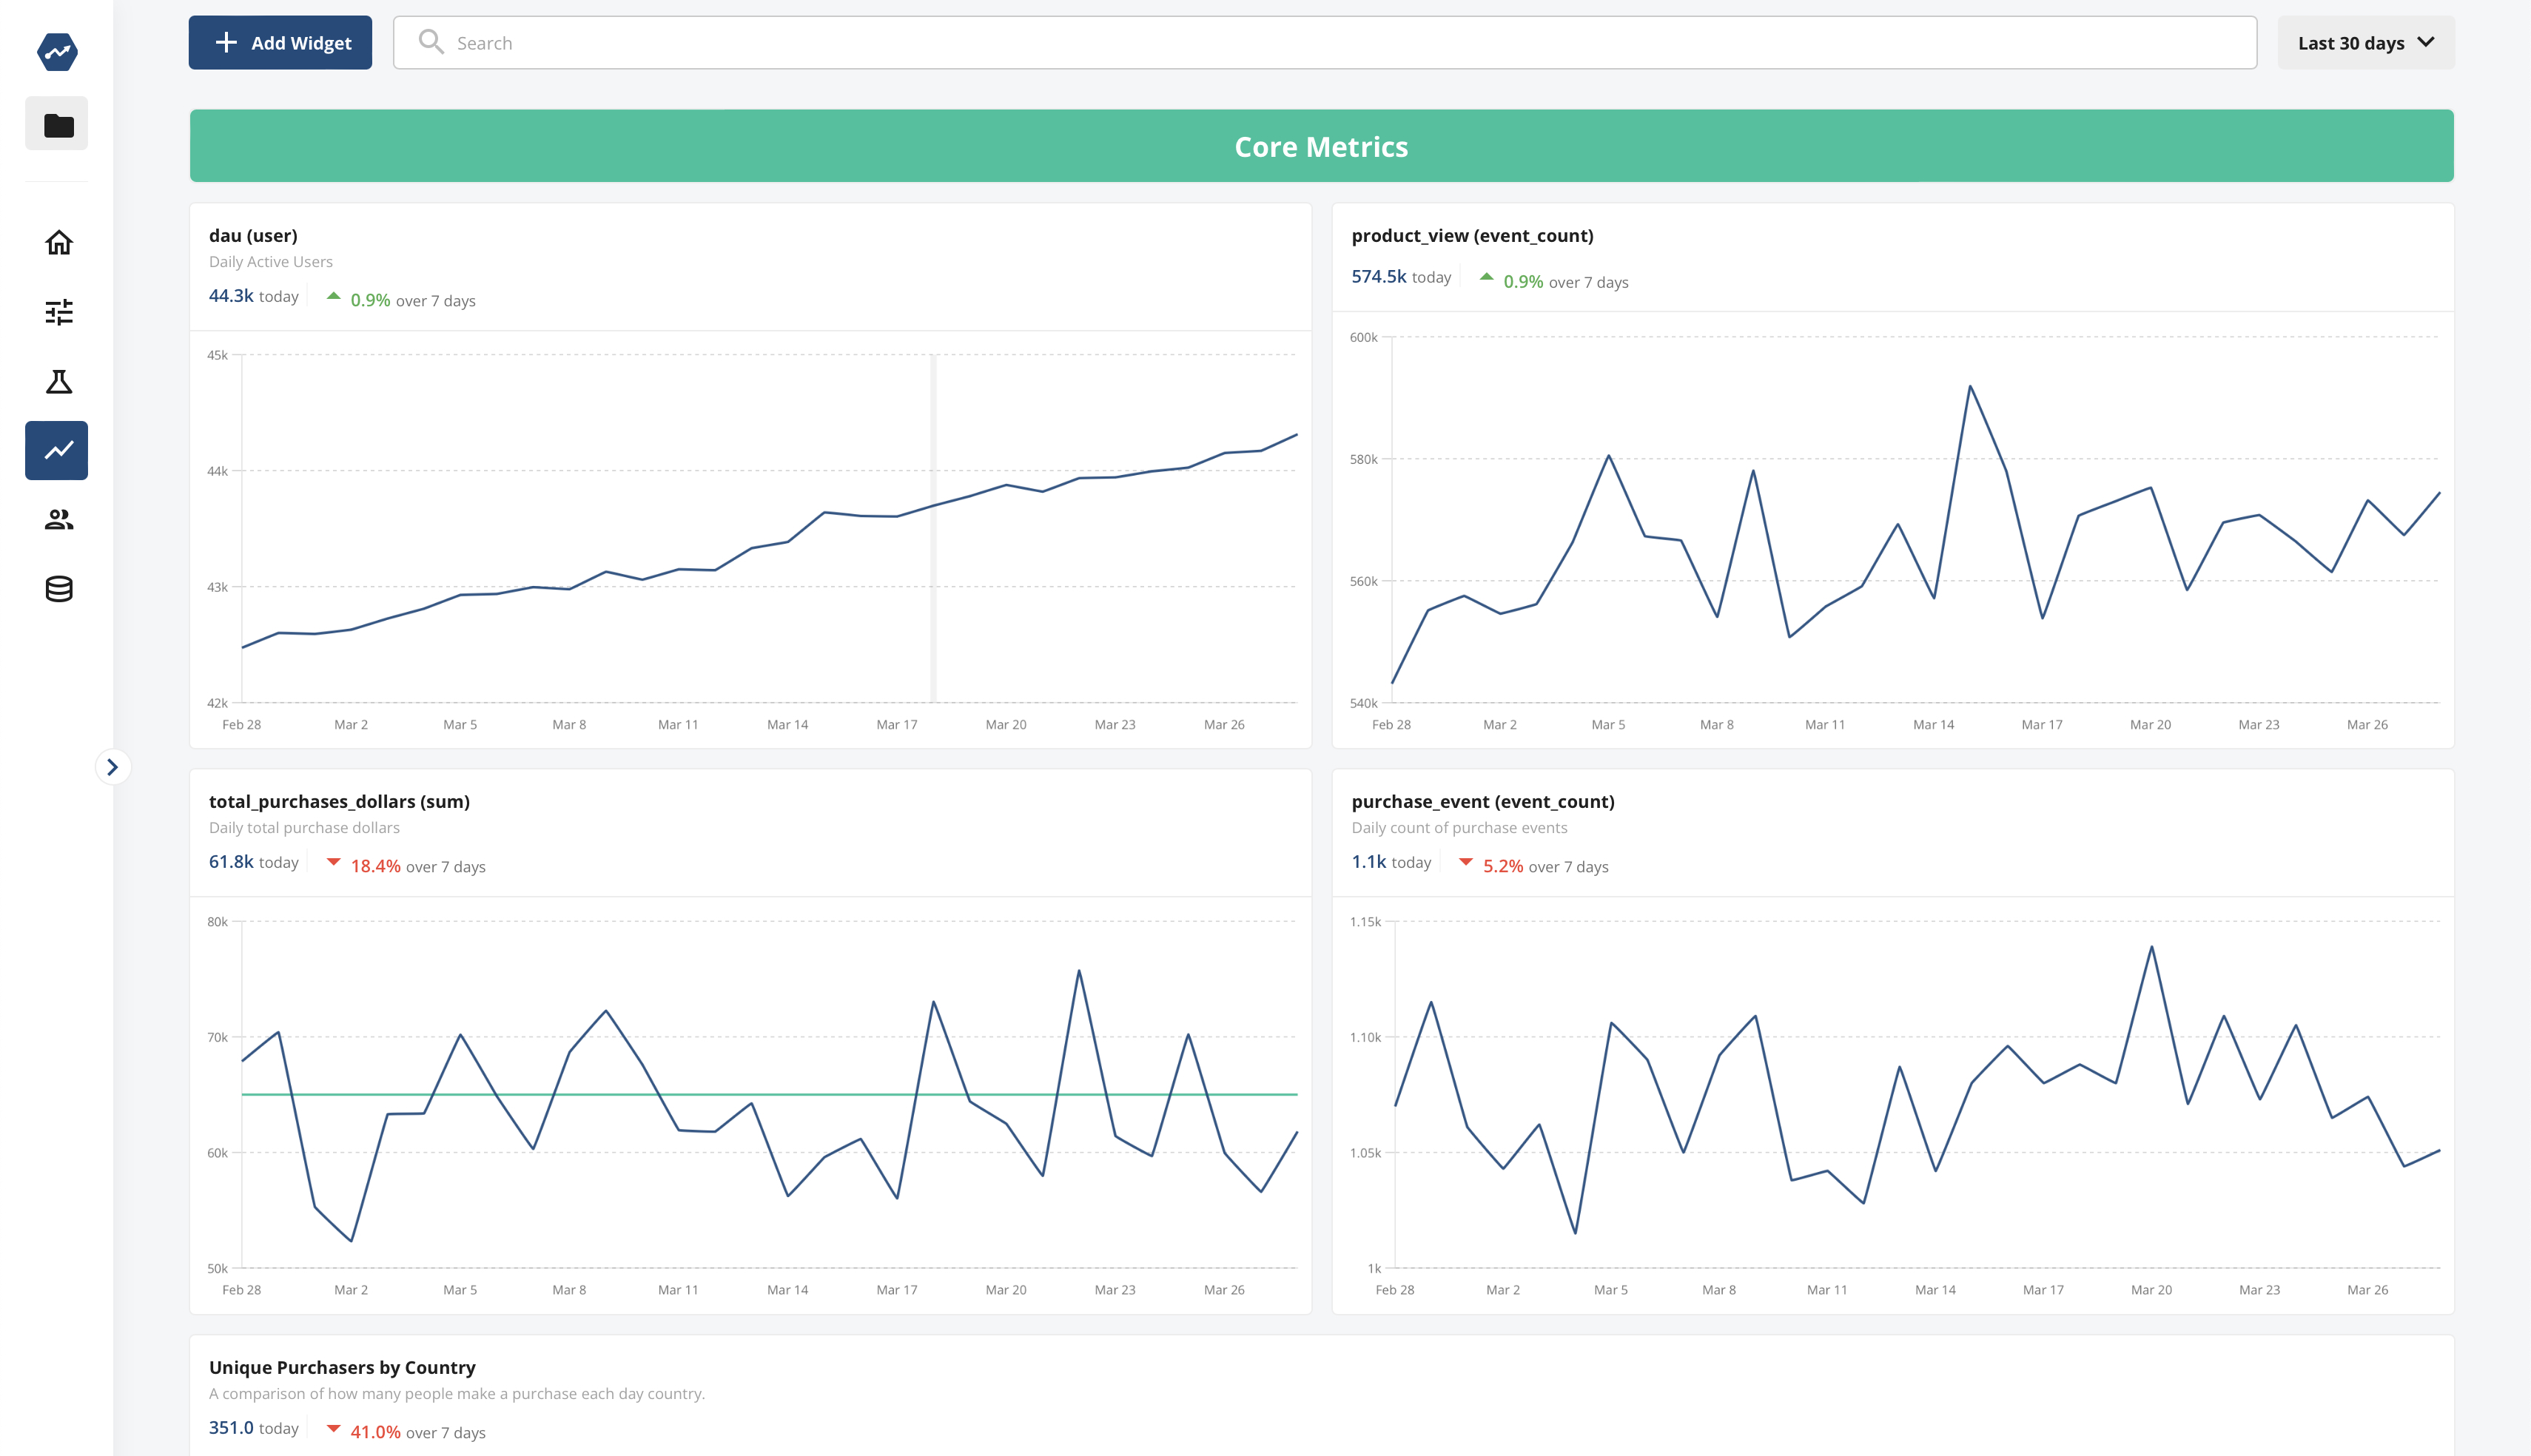
🌸 Dashboards Spring Cleaning
We've recently made some quality of life improvements to help you find dashboards more easily and quickly derive meaningful insights.
Dashboard Summaries and Settings
When viewing dashboards, we've made it simpler to grasp the most important insights at a glance. Charts on dashboards now, by default, show the latest metric value and the percent change over time for the metric being plotted. This makes understanding current product health more straightforward than ever. You can also edit the summary value being display as the latest value, average value, or cumulative value of the metric over the time range.
Favorite Dashboards
You can now mark dashboards as favorites if they are particularly important to you. Your favorite dashboards will always appear at the top of your dashboard list, making them easier to access and ensuring you quickly get to the data that matters most.
Popular Dashboards
We've also added a new "Popular Dashboards" section to the dashboard list view. This feature makes it easy to discover dashboards that are popular within your project, helping your team share insights and context around the dashboards and product data that are proving most insightful.