Platform
Developers
Resources
Documentation
Walkthrough Guides
SDKs and APIs
Integrations
A/B Testing Calculator
How Statsig Works
Blog
Support
Customer Stories
Events
Build vs Buy
Contact Sales

Feature Flags Liberated
Gating features is a core part of the development process. And with Statsig, it's free.
How AI Companies Use Statsig
The best AI companies use Statsig to accelerate growth. Learn how you can do the same.
What is Product Observability?
Product observability means being able to monitor, control, and gain insight into all of your features.Documentation
Walkthrough Guides
SDKs and APIs
Integrations
A/B Testing Calculator
How Statsig Works
Blog
Support
Customer Stories
Events
Build vs Buy
Contact Sales
Experiments with Generative AI
We built a generative AI app in reactJS using OpenAI’s API and Statsig. Here’s what we learned:
Experimentation Platforms
The decision to build versus buy an experimentation and feature flagging platform is not an easy one.
CUPED Explained
CUPED is an implementation that uses pre-experiment data to explain the variance in the result data.Today we’re going to walk through some thoughts on how to approach picking metrics for an experiment.
This isn’t exhaustive, but it should lay solid groundwork for setting yourself up for success with experimentation.
Let’s start with a short video, and discuss!
In the video above, we gave advice on how to approach picking the right metrics for an experiment (or conversely, how to avoid picking bad metrics!)
This will always require some thought, and understanding of the product changes you’re trying to achieve, but with practice it becomes second nature to have a strong, measurable hypothesis and a portfolio of secondary metrics to monitor.
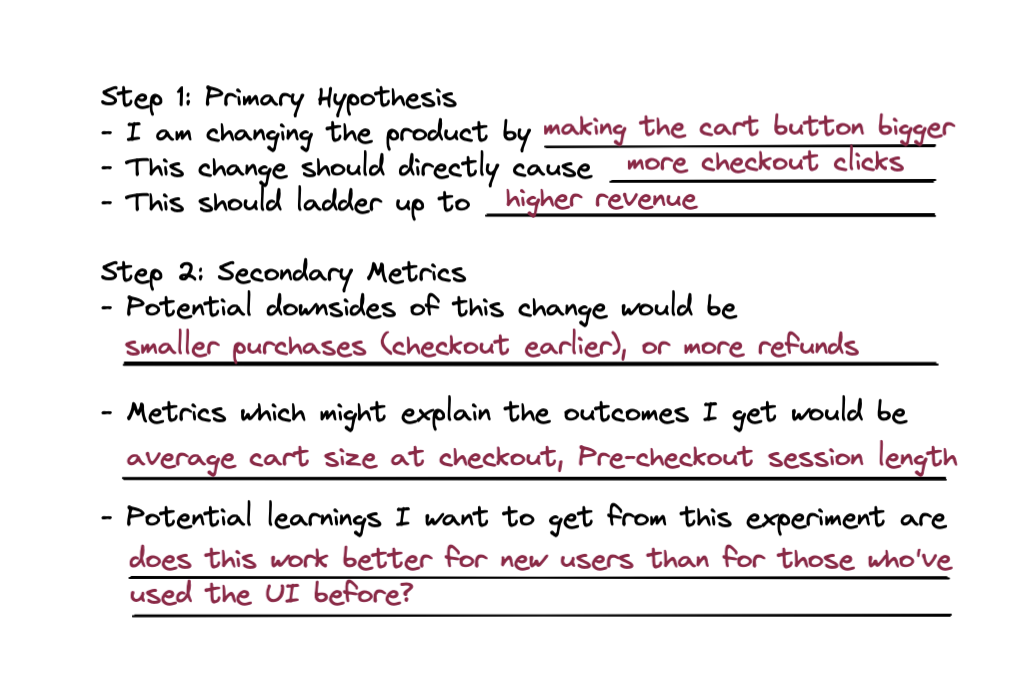
Here’s my mental card when I get started:
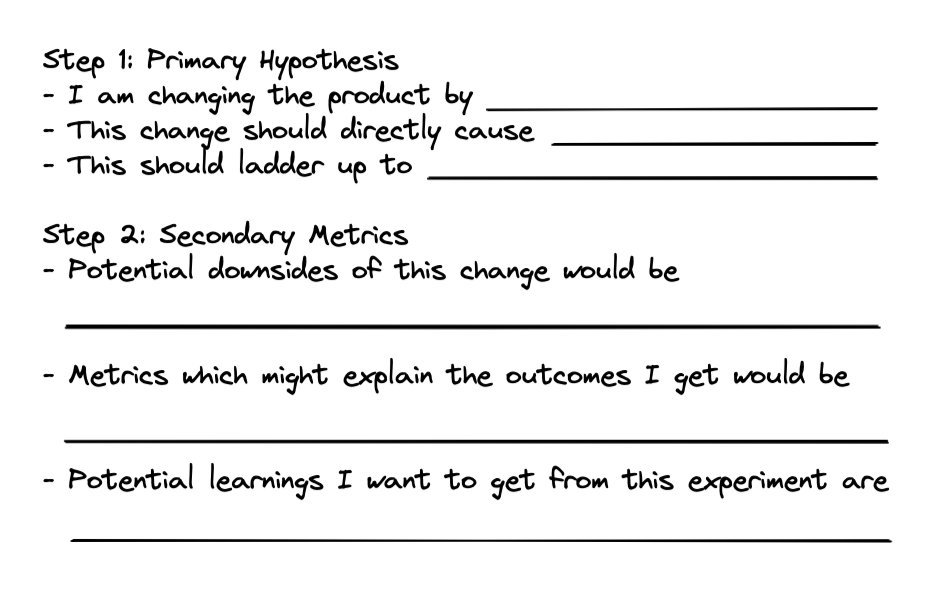
Let’s walk through this together!
Step 1: Stating a Hypothesis
Your primary evaluation should be on 1–2 metrics that tie directly into a specific hypothesis. Our suggested approach is to start by breaking what you’re testing into two pieces:
What is a direct, granular action that you think you will change?
This should be an immediate outcome of your change, and generally should be a necessary (but not sufficient) outcome for your experiment to succeed. We would call this a “mechanical” or “behavioral” metric. Answer the question “what is the first thing I would see if my experiment worked?
”Examples: clicks, 60-second page views, conversions.
What business outcome should this ladder up to?
Generally, you’re making a change in order to help drive a high-level business outcome; this metric represents that outcome and answers “why” you’re making this change. Sometimes this can’t be measured directly (“Satisfaction”) but can be measured through a proxy metric (“Retention”).
Pick an appropriate scope for this metric. A UI tweak in a menu likely won’t affect revenue enough to be observable, but you might try to measure a low-level strategic outcome like reducing “time to menu click”.
Why do we suggest two steps?
Breaking our hypothesis down this way allows us to clearly state it in terms of what we’re driving, and what we expect that to lead to.
I think by making the cart button bigger, we can drive more clicks on it. I think this might drive more revenue through more checkouts.
Your business outcome doesn’t need to follow immediately from the behavioral outcome, but you should be able to explain how you’d get from the behavioral metric to a change in the business metric. This is a good way to validate that your hypothesis makes sense in the first place.
This is also useful for framing your analysis. If you don’t see your business outcome move, you already have the first step for diagnosing this built-in:
If your mechanical metric moved, the relationship between it and the business outcome might be weaker than you thought, or there’s additional work you need to do to actualize the impact of that behavior
If your mechanical metric didn’t move, your change probably didn’t drive much of a change in user behavior — so you might instead focus your efforts on making your treatment effective
Step 2: Develop Secondary Metrics
Once you’ve done the above, congrats! You have a clear and measurable hypothesis. However, products are complex. It’s usually a mistake to see a positive result and assume the result is an unmitigated victory. You can proceed with much more confidence after thinking through what your secondary metrics should be.
Consider Potential Costs/Downsides
Consider the ways that your change could lead to a worse user experience. How could you try to measure if that’s happening? This is how you develop good counter-metrics, which you check to make sure you’re not accidentally causing regressions.
Common examples:
Making a feature more prominent reduces usage on other parts of the product (“cannibalization”)
Sending more notifications drives engagement, but leads to lower click-through rates and more users opting out of notifications. (You might even want to set up a holdout to track the long-term impact of notifications!)
Conversion rate goes up, but total conversions go down because less users enter the funnel — with ratio metrics, you will generally want to track the numerator and denominator in addition to the ratio itself
Sometimes, you can help yourself by picking a business metric that addresses these counter-metrics. Let’s say you’re a subscription service and want to increase conversion, but you’re worried that you’ll increase refunds as well. Tracking “Revenue Minus Refunds at Day 7”, instead of “Gross Revenue” means your business metric will be much more robust to movements in early refunds.
Consider Adding Explanatory Metrics
In addition to your mechanical metric above, you might want to add color by filling in the mathematical steps between “point A” and “point B”.
For example, if your business metric is “Revenue”, and your mechanical metric is “Checkouts”, you’d want to also track “Average Purchase Size in USD” to connect the formula ofRevenue = [Checkouts * $/Checkout]
Think Through Potential Learnings
Experiments can provide valuable information outside of the scope of your hypothesis. While you need to treat incidental observations with some skepticism due to the inherent noise in experimentation, it’s a good practice to use experiment results to form new hypotheses.
For example, let’s say you’ve heard that users in country A like dropdown menus and users in country B like type-aheads. However, you’re not sure if this is true, or causal.
If you happen to have run an experiment that switches a button to a typeahead for all users, you can split the results by country to get some causal signal on if users in those countries truly have different preferences. It’s not your main hypothesis, but it’s an important learning! Looking for these free insights is a great way to get more value out of your data.
Sanity Check:
Once you’ve done this, You should be able to state the results of this exercise in plain language:
Lastly — Some Dos and Don’ts!
Do
Have one clear behavioral metric you’re aiming to change, and an appropriately scoped business metric it should ladder up to.
Think about “what I’ll think if I see this metric move”. Argue with yourself before you see any data — it’ll help you avoid pitfalls!
Consider negative consequences your changes might cause, and proactively measure them
Try to have background/context metrics that can help generate hypothesis around what drove your primary metric’s movements (or lack of movement)
Consider what you can learn from this experiment for follow-ups, and make that a clear part of your proposed analysis
Use a power calculator to make sure you’re getting enough power and to know when to check your results
Don’t
Blindly stick to the same business metric. Consider what your change should drive, and what an appropriate target is.
Generate too many behavioral metrics to check. This can make your analysis confusing and lead to false positives in either direction. In the example above, we’d want to pick just one of “clicks” or “checkouts” as our hypothesized behavioral metric.
Over-index on the results of metrics which aren’t your primary hypothesis, especially if you’re looking at subpopulations. With experimental error, it’s really easy to find accidental “wins” or “losses” if you slice things up too much. Use learnings/explanatory metrics for
directional, inconclusive
insight on where to look next
Stay ahead of the curve


Recent Posts
Announcing Session Replay
What if you could rewind the exact moment a user didn't convert through a funnel and watch how it unfolded?
Mastering marketplace experiments with Statsig: A technical guide
Marketplace experiments can have a ripple effect, impacting buyers, sellers, and the health of your platform. Here's how to experiment effectively.
Product analytics 101: Video Recording
Watch Akin Olugbade's recorded session wherein he discusses how to cultivate a data-driven culture using analytics, and why we decided to create this product.
When to use Bayesian experiments: A beginner’s guide
Where frequentist statistics assigns probabilities to data, Bayesian assigns probabilities to hypotheses. Here's why some experimenters opt for the latter.
Running experiments on Google Analytics data using Statsig Warehouse Native
Leveraging Google Analytics data for experimentation is powerful. Statsig Warehouse Native can help.
Announcing Statsig Sidecar: Website A/B tests made easy
With Statsig Sidecar, marketers and web developers can run experiments and A/B tests directly on a website without writing any code.